Download

1 / 11
110 likes | 266 Views
Linking Quality to Strategy: Benefits of Balanced Scorecards in the Public Sector. Seminar on “Quality Manager in the Public Sector” Romania, 10-20 March 2008. Origin of Balanced Scorecards.

E N D
Linking Quality to Strategy: Benefits of Balanced Scorecards in the Public Sector Seminar on“Quality Manager in the Public Sector”Romania, 10-20 March 2008
Origin of Balanced Scorecards • The original Balanced Scorecard (Kaplan and Norton, 1992) was focused on reporting performance and very private-sector oriented • Now, it is a tool for strategy development and testing and is applicable for public and nonprofit sectors, as well
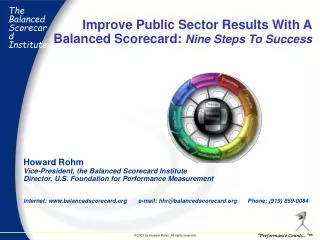
Financial Financial Customer Customer Operational and process Operational and process Learning and innovation Learning and innovation A DEVICE TO BUILD CAUSE AND EFFECT WITHIN YOUR BUSINESS + A GOAL SETTING TOOL STRATEGY Figure 3.2General flow of the Balanced Scorecard. (SOURCE: The Balanced Scorecard, David Norton, Renaissance Strategy Group, Lincoln, MA, and Robert Kaplan, Harvard Business School).
Community First Customer First Funding the Future People Matter Performance Counts
Developing the Scorecard • What are we trying to achieve? (Community Priorities) • What key things do we need to get right to achieve them? (Strategic Objectives) • How do we know if we are getting there? (Measures and Targets)
Building Confidence, Enhancing Reputation Embed the Core Competencies Building Project Management Skills Providing Strategic Leadership Supporting Innovation, Risk & Reward The Barking and Dagenham Balanced Scorecard Strategy Map Raising Pride Developing Rights & Responsibilities Promoting Equal Opps, Celebrating Diversity Improving Health, Housing, Social Care Cleaner, Greener, Safer Better Education & Learning for all Regenerating Local Economy Community First Meeting Customer Needs First Providing Accessible, Local Services Improving Standards Community Leadership Role Every Pound Counts Allocating resources to support priorities Investment through Partnerships Customer First Funding the Future- Financial & Resource Perspective Redesign Processes & Programmes to put Customers First Performance & Accountability Empowering Decisions, Informing Choice Integrated Financial & Service Planning Excellence through Partnerships Performance Counts - Organisational Processes Perspective People Matter - Learning & Growth Perspective
% of residents with a positive perception of the Borough • The level of the “Equalities standard” for local government to which the Council performs • The level of the “Equalities standard” to which B&D public sector bodies perform • Numbers of citizens involved in Council consultations • Number of deaths by Heart Disease in B&D • % of homes that meet the decency standard as a percentage of total public & private stock • % of residents with a positive perception of public safety • % of residents with a positive perception of the overall appearance of the Borough • % of education & learning indicators at above national average • % of education & learning indicators at or above top quartile • Average income of B&D citizens Community First Funding the Future • % of residents satisfied with the quality of services • % of access indicators at or above top quartile • % of quality & service outcome indicators at or above top quartile • % of community strategy actions delivered on time & as planned Customer First • % of cost indicators in best quartile • % of Capital schemes delivered on time & within budget • % of overall budget which is re-directed to priorities • % of capital funding generated from external sources • % of revenue funding generated from external sources People Matter • 1-10 rating by key stakeholders against reputation drivers • % of staff satisfied with the quality of their appraisal & personal development planning • % of managers trained in project management techniques • % of staff who are satisfied that the leadership of their manager enables them to place their work in the context of the Community Priorities and/or strategic objectives • % of BV inspections that indicate confidence in the Council’s ability to make improvement The Scorecard Performance Indicators • % of interactions with the public that are delivered electronically e.g. by telephone, internet. • % of staff who are set performance targets as a result of appraisal/appointment • % of reports to members that are appropriate & of good quality • % of Balanced Scorecard actions implemented on time and as planned • % of partnership strategies/action plans delivered on time & as planned Performance Counts
Service Scorecards • Each of the 29 Service Heads produce a scorecard, which translates the corporate scorecard to the service level and takes account of specific service pressures e.g. from government departments. • Each Service Scorecard sets out: • strategic service objectives and measures • an implementation plan of how the targets will be delivered.
Objectives Measures Targets Objectives Targets Measures Objectives Measures Targets Objectives Targets Measures Example of a Balanced Scorecard in a UK hospital Patients and Community Service Delivery Organisational Development Financial