Download
1 / 21
220 likes | 332 Views
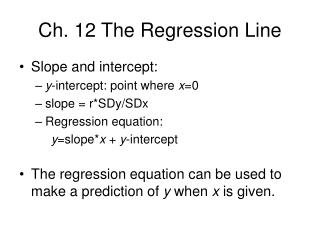
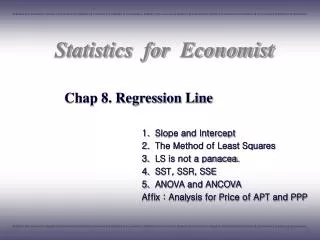
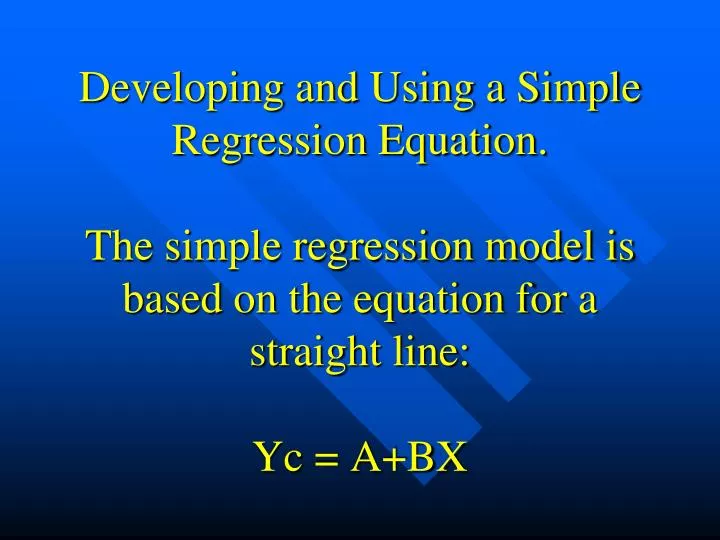
Developing and Using a Simple Regression Equation. The simple regression model is based on the equation for a straight line: Yc = A+BX. Yc = A+BX where: Yc = the calculated or estimated value for the dependent variable A= the Y intercept B= the slope of the line X = independent variable.

E N D
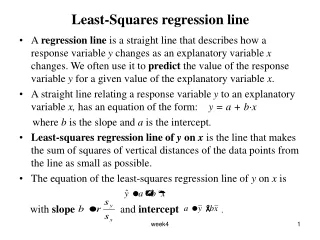
Developing and Using a Simple Regression Equation.The simple regression model is based on the equation for a straight line:Yc = A+BX
Yc = A+BXwhere:Yc = the calculated or estimated value for the dependent variableA= the Y interceptB= the slope of the lineX = independent variable
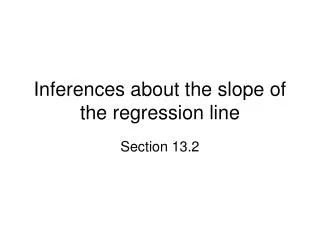
Graphical depiction of a regression line Y Yc = A + BX slope intercept X 0
How can we estimate next year’s yield? Take the average?
What might trend represent?Technology – innovation – hybrid development
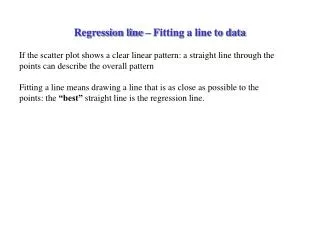
We want to find the line of best fit.An average just won’t cut it.
Graphical depiction of a regression line Y * * * * * * X 0
Step 1: Collect the historical data.Every Y observation must have an X.
Step 4. Compute the slope (B) and Y intercept (A) B = XY – n X Y ------------------ X2 – n X2
B = 1823124 – (7*1997*130.414)______________________27916091 – (7*1997*1997)B = (67/28) = 2.3929
A = 130.414 – (2.3929 * 1997)A = 130.414 – 4778.62A = - 4648.20