Download
1 / 1
20 likes | 214 Views
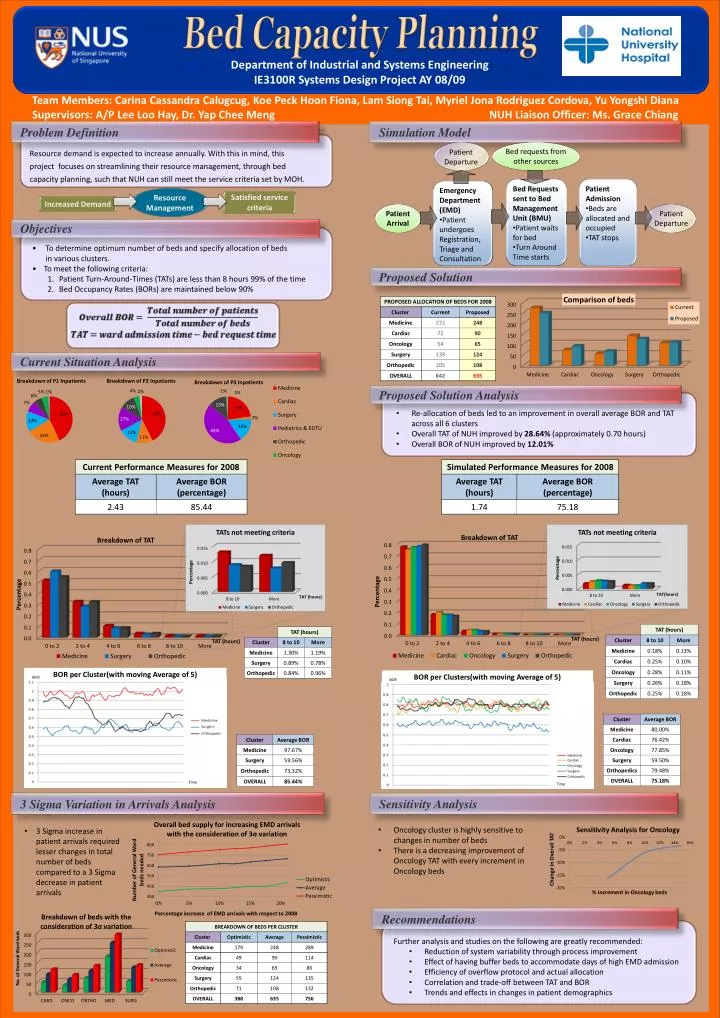
BOR per Clusters(with moving Average of 5). Bed Capacity Planning. Department of Industrial and Systems Engineering IE3100R Systems Design Project AY 08/09. Team Members: Carina Cassandra Calugcug, Koe Peck Hoon Fiona, Lam Siong Tai, Myriel Jona Rodriguez Cordova, Yu Yongshi Diana

E N D
BOR per Clusters(with moving Average of 5) Bed Capacity Planning Department of Industrial and Systems Engineering IE3100R Systems Design Project AY 08/09 Team Members: Carina Cassandra Calugcug, Koe Peck Hoon Fiona, Lam Siong Tai, Myriel Jona Rodriguez Cordova, Yu Yongshi Diana Supervisors: A/P Lee Loo Hay, Dr. Yap Chee Meng NUH Liaison Officer: Ms. Grace Chiang Time Problem Definition Objectives Simulation Model Bed requests from other sources Patient Departure • To determine optimum number of beds and specify allocation of beds • in various clusters. • To meet the following criteria: • Patient Turn-Around-Times (TATs) are less than 8 hours 99% of the time • Bed Occupancy Rates (BORs) are maintained below 90% Resource demand is expected to increase annually. With this in mind, this project focuses on streamlining their resource management, through bed capacity planning, such that NUH can still meet the service criteria set by MOH. • Bed Requests sent to Bed Management Unit (BMU) • Patient waits for bed • Turn Around Time starts • Patient Admission • Beds are allocated and occupied • TAT stops • Emergency Department (EMD) • Patient undergoes Registration, Triage and Consultation Resource Management Satisfied service criteria Increased Demand Patient Departure Patient Arrival Proposed Solution Current Situation Analysis Proposed Solution Analysis • Re-allocation of beds led to an improvement in overall average BOR and TAT • across all 6 clusters • Overall TAT of NUH improved by 28.64% (approximately 0.70 hours) • Overall BOR of NUH improved by 12.01% BOR per Cluster(with moving Average of 5) BOR BOR Time 3 Sigma Variation in Arrivals Analysis • 3 Sigma increase in patient arrivals required lesser changes in total number of beds compared to a 3 Sigma decrease in patient arrivals Recommendations Sensitivity Analysis • Further analysis and studies on the following are greatly recommended: • Reduction of system variability through process improvement • Effect of having buffer beds to accommodate days of high EMD admission • Efficiency of overflow protocol and actual allocation • Correlation and trade-off between TAT and BOR • Trends and effects in changes in patient demographics • Oncology cluster is highly sensitive to changes in number of beds • There is a decreasing improvement of Oncology TAT with every increment in Oncology beds