Download
1 / 30
300 likes | 319 Views
Data Visualization. Increasing Understanding and Access to Information. What makes a good infographic/visual?. http://www.bbc.co.uk/gel/guidelines/how-to-design-infographics. Does it have the right amount of information? Is it telling the story you want to tell?. Should draw the eye

E N D
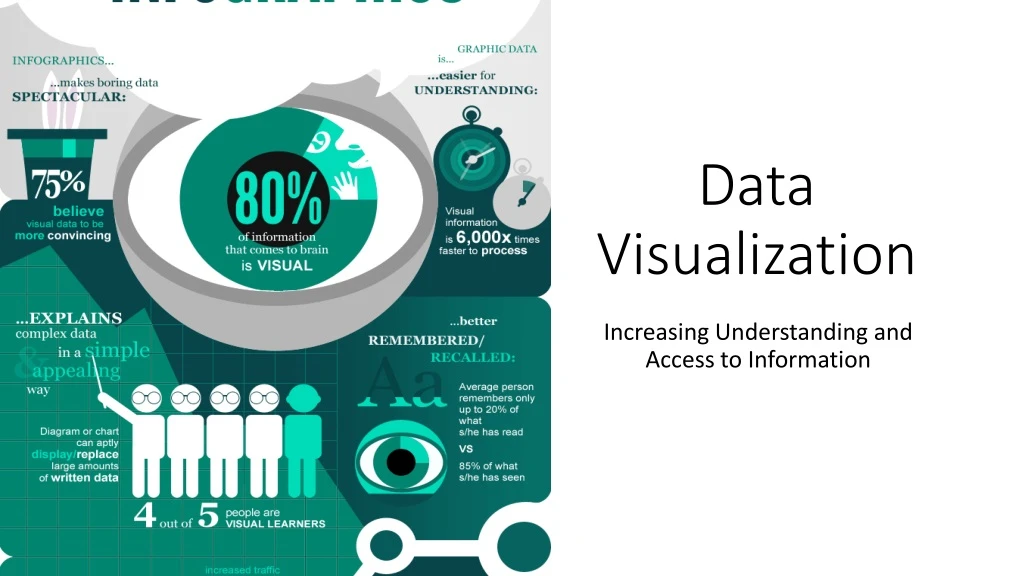
Data Visualization Increasing Understanding and Access to Information
What makes a good infographic/visual? http://www.bbc.co.uk/gel/guidelines/how-to-design-infographics • Does it have the right amount of information? • Is it telling the story you want to tell? • Should draw the eye • Balance on the page • Is it easy to understand? • Does your audience have to work to read it?
How to get started • What’s the point/message? • Who is your audience? • Donors, participants, CARE colleagues, other NGO colleagues • Others? • What is the best chart type? • How do we sharpen the point?
Sharpening the point • Label data directly (and make sure they are legible) • Use color to highlight • Re-order data (greatest to least) • Remove chart junk • Use color to highlight key patterns This Photo by Unknown Author is licensed under CC BY-SA
Women’s Empowerment Decision making Access Income Diversification Climate change adaptation Women’s Participation Social norms 74.7% 61% • 47% FHH participate in public meeting • 65% FHH are receiving financial and IGA SPM Training • 65.5% FHH are VSLA members • 61% FHH are PMA members • 41% FHH are SAA members • 7,447,646 birr disbursed for women’s from FSP • 57% FHH are linked to FSP • 32% FHH increase their income • Avg loan size increase 21.3 USD • Increase in 64.2% of women engaged in economic activities • 71% women reporting meaningful participation in decision making related to economic activities • 90% of women are with proper knowledge on climate adaptation practices • 67% of women are practicing at least one adaptive practice • 29% FHH are actively engaged in social activities • Community is willing to challenges the gender barriers • Gov’t experts are facilitating sessions to help communities understand and act on gender barriers to food security • Men engaged in HH chores 5’ Control 61.5% Food Sufficiency for Farmers (FSF)
FSF+ Marketing and Value Chain Approach and off- farm IGA Intervention The Project Follow Market led Approach to Deliver Business Solution for Poverty Selected VC commodities Haricot bean value chain Sheep and Goats value chain Honey value chain Ox Fattening Pepper Facts and Figures on value chain financing and Market Linkage • 224 PMA’s are organized • 13 PMA were licensed as trader to act between informal group and formal business • 4,400 (58% Females)Participant organized in PMAs to produce high value agricultural products • 2651 Females engaged in fattening • 57% Females linked to FSP. • 7,447,7646 birr disbursed for women's from FSP • PMAs achievements via Artificial Market • 25% livestock purchased by EU recovery project were supplied by FSF PMA • from that they generate 204,390/10,219 USD net profit within six month • PMA won to supply 4628 shoat to GROW project • FSF+ Agro dealers also won competitive bed to supply Vegetable seed to GROW project • Expected Net Profit • 677,190 birr/ 33,859 USD FROM Artificial market linkages • activities. FSF+ Value Chain Approach • PMA approach: FSF organizes the target households for value chain intervention. PMA is an informal association of FSF target beneficiaries, to benefit target farmers from input and output markets • Private and Public sectors • engagement: FSF+ facilitate linkages between selected private actors to address farmers requirement of quality and improved inputs to increase productivity and market • Agro Dealer approach • The agro dealers are selected based on their agricultural input supply experience, Interest, business skill, financial management capacity and location to serve project beneficiaries/PSNP HHs. • Micro franchising Social Business Model • To promote off farm IGA the Project also use Micro franchising Business model. • Through the process the sales women now obtain profit up to 1200 ETB (57 USD) per month from the door to door sells as an additional income. “I am very happy with my life now more than ever! I can support my family and take care of my children properly and send them to school. My relationship with my spouse and community has been great. My Participation on small business and value chain support me to crate asset and additional income, I can confidently say that I am on the right track of graduation from PSNP program thanks to CARE FSF+ Project support. (Fatuma Abdella)”
Improved Resilience Through Climate Change adaptation “We Can Do It” 3 Farmers Training Centers upgradedand are providing training on climate –smart agriculture practices 80% female farmers are earned average of 181USD due to climate smart agriculture practice during El Nino triggered drought . 95% targeted beneficiaries have increased knowledge on climate change adaptation practices 11 FSF operational woredas are mainstreaming DRM plan 90% targeted house hold implemented at least one Climate change adaptation Abebech Tekabe is a 32-year-old mother of six who lives in Lafto Hunde, West Hararghe. She learned about VSLA and business with the first loan from her VSLA(800ETB) she bought beans and sold them 1200ETB. In three days time, she was able to earn a profit of 400ETB.. Eventually, the family would have been forced to sell all of their assets. Threatened by the crisis of drought, Abebech’s family would have been the first one survived fromEli no. Providing training on climate Vulnerability and mapping to disaster risks, Contingency planning for gov’t sectors Conduct community dialogue sessions on respond to disasters to protect development gains Develop DRM/CCA mainstreaming guide 45(28 are Females) Role models are trained in trained on facilitation and communication skills Provide low-risk high yielding crop variety, & Livelihood support to the poor through VSLAs For 1,481 beneficiary Conduct school events for school community on DRR and CCA for 1,725 beneficiary Scaling up resilience and good practices Strengths and limitations in promoting resilience for Gov’t and other institutions)
CARE HonIntervention Model shield • Risk Management Climate change adaptation • Inclusive Economic Development • Improve Access to hydric recourses • Reduce • inequality shield • FNS shield Increase Resilience
Why? • FNS • Inclusive Economic Development • Access to Water
Impact multiplication • Innovative Solutions ROLES • AccesoMejorado a losRecursosHídrico • AccesoMejorado a losRecursosHídrico • DesarrolloEconómicoInclusivo • DesarrolloEconómicoInclusivo • SeguridadAlimentaria y Nutricional • SeguridadAlimentaria y Nutricional • ADAPTABLE MODEL • AccesoMejorado a losRecursosHídrico • DesarrolloEconómicoInclusivo Approaches SHIELD • Gender equality. • Right Approach • Governability, advocacy y institutional strengthening. • CCA • Risk Management • Increase Resilience. • SeguridadAlimentaria y Nutricional
Reflective Questions • What is the data telling you? • What do you think is occurring here and why? • What really stands out for you? • Are there any surprises here? • How does it align with your expectations? • Is this better or worse than you expected? • What response do you think is required here? • How viable are these recommendations? • Which feel most doable? • How might we best communicate these findings to decision-makers?
Data Placemats https://www.innonet.org/
Free/low cost tools Graphic design • Canva • Easel.ly • Venngage Data visualization • Tableau public • Excel and Excel tips • PowerPoint • Google • Microsoft Power Bi
Pathways Malawi • Using a strong gender focus, CARE’s Pathways program seeks to increase poor women farmers’ productivity and empowerment in more equitable agriculture systems at scale. • Thus, the program theorizes that marginalized, poor women farmers will be more productive, and that their families will be more food secure when: • Women have increased capacity (skills, knowledge, resources), capabilities (confidence, bargaining power, collective voice), and support • Local governance and institutions have/implement gender-sensitive policies and programming that are responsive to the rights and needs of poor women farmers • Agricultural service, value chain, and market environments of relevance to women are more competitive, gender-inclusive, and environmentally sustainable.
5 minutes of inspiration: Pathways Malawi What did we accomplish? • Increased income: Household income went up 76%, from $11.40 a month to $20.08. Households were also able to spend 38% more every month. Women’s income from agriculture improved 53%. • Better diets: Dietary diversity went up 13%, so families are able to have more balanced diets every day. Women also got more balanced diets—seeing an increase of 9%. • More resilience to climate change: Families are 31% more likely to be using savings to deal with shocks—which is incredibly important in the face of the massive El Nino drought they are having. They are also 2.6 times more likely to be using drought-tolerant crops. • Climate-resilient crop production: In a year where crop production has dropped between 35 and 50% across the districts where Pathways operates due to the drought, Pathways families have seen their production hold steady. In non-drought years, they saw impressive production increases • More household assets: Families own twice as many assets as before, which can help cushion in emergencies. Land ownership was particularly important—it more than doubled from 2 acres at baseline to 4.3 at endline. The number of women who could control land went up 16% • More diverse livelihoods: The number of families who diversify their livelihoods as a way to protect against potential shocks went up 23%. • More empowered women: the number of women who were empowered according to CARE’s Women’s Empowerment Index went up 38%, and the average empowerment score increased by 10%. Women are 28% more able to control income than they were before Pathways. How did we get there? • Put women in charge: The number of women in leadership roles went up 36%, and women feel much more comfortable speaking up for their rights. • Get women access to tools and information: Women’s access to financial services went up • 21%, and their access to agricultural inputs increased by 10%. The number of women using improved seeds (drought tolerant or higher yield) nearly doubled. All of the focus groups mentioned that improved access to information was one of the most important benefits they received. • Focus on extension services: Women’s access to extension services nearly tripled, from 29% at baseline to 82% at the end of the project. Women who were not a part of the project consistently reported that even though Pathways didn’t target them, they also benefitted from increased access to services and information. • Teach good agricultural practices: Women’s use of improved agricultural practices went up 49%, with especially big jumps in improved seeds and post-harvest practices that mean they lose less food. There was a 65% increase in women producing their own organic fertilizer so that they could improve their practices without spending more money. • Help women access markets: Women’s access to markets so they could sell their crops for higher prices went up 50%, and 63% of women could access markets by the end of the project.
23%of families diversified their livelihoodsto protect against shock
Slide makeover Before After
Resources • CARE Icons (will pass around flash drive) • Data visualization tips • Data Visualization Handout (4 step data viz process) • Data Visualization Checklist or Interactive Version (online) • Data Slide Makeovers
Donut Chart • The Donut Chart shows the numerical proportion to a whole • Input:
Bar Chart • The Bar Chart shows categorical data grouped into discrete groups • Input:
Group Activity • Split up into 12 groups (2 per CO) • Each group will be given: • A scenario • Sample data or your choice of a data summary • https://bit.ly/2rKxMxj (shorter link to gender marker data) • A key audience to present to • Identify the best way to present this information to your audience • Gallery walk presentation, comments, and discussion
Questions? • Contact Korinne Chiu at Korinne.chiu@care.org
Reflections • What did you think of the activity overall? • What was most difficult? • How can you see this fitting into your daily work?