Download
1 / 21
230 likes | 334 Views
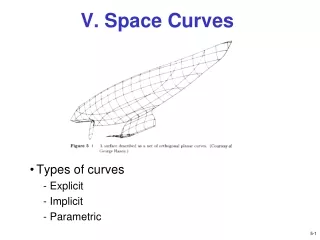
Space-Filling Curves in Information Visualization. Jiwen Huo jhuo@cgl.uwaterloo.ca. Space-filling curves. Definition: A continuous curve which passes through every point of a closed n-cell in Euclidean n-space E n is called a space filling curve (SFC). Application of SFC.

E N D
Space-Filling Curves in Information Visualization Jiwen Huo jhuo@cgl.uwaterloo.ca
Space-filling curves • Definition: • A continuous curve which passes through every point of a closed n-cell in Euclidean n-space En is called a space filling curve (SFC).
Application of SFC • Mapping multi-dimensional space to one dimensional sequence • Applications in computer science: • Database multi-attribute access • Image compression • Information visualization • ……
Categories of SFC • Non-recursive • Z-Scan Curve • Snake Scan Curve • Recursive • Hilbert Curve • Peano Curve • Gray Code Curve
Non-recursive Space Filling Curves Z-Scan Curve Snake Scan Curve
Recursive Space Filling Curves Hilbert Curve Gray Code Curve Peano Curve
3D SFC Hilbert Curve Z Curve Peano Curve
Hilbert Curve Z Curve Z Curve Hilbert Curve Good Good Properties of SFCs • Coherent in Continuity • Clustering Property • Direction Preserving
Direction Preserving P1: (X1, Y1) X1 > X2> X3 P2: (X2, Y2) Y1 > Y2> Y3 P3: (X3, Y3) Z(P1) > Z(P2) > Z(P3) H(P3) < H(P1) < H(P2)
SFC in Information Visualization • Example Data • Color (R, G, B: [0, 255]) • Data with obvious geometric pattern • 4D Hyper Sphere • Data without obvious geometric pattern • Iris flowers (5 attributes, 3 classes) • Example SFC • Z-Curve • Hilbert Curve
(160, 100) (160, 100, 100) ? 100 Visualizing Color (RGB)
Visualizing Color (RGB) Z-Curve Mapping
Visualizing Color (RGB) Hilbert Curve Mapping
Visualizing Color (RGB) Green & Blue Z Red H
Z-Curve Visualizing 4D Hyper-Sphere Surface • Hilbert Curve
Z-Curve Hilbert Curve The Visualization of Iris Flowers
The Visualization of Iris Flowers • Extended Hilbert Curve