Download
1 / 20

E N D
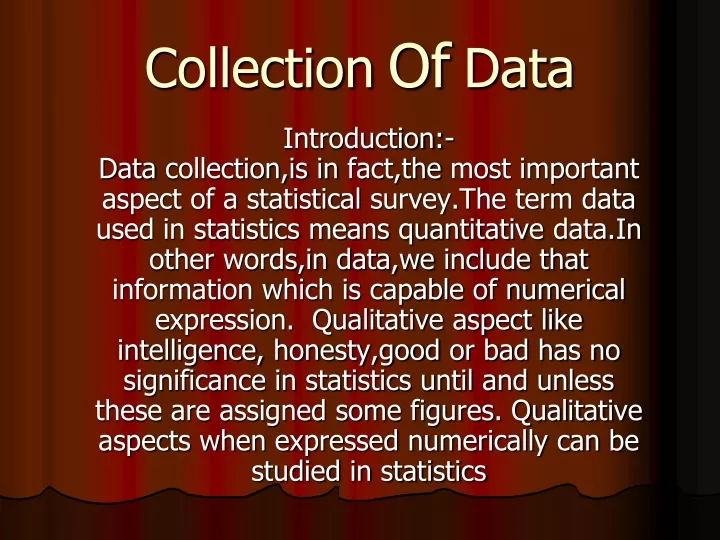
CollectionOfData Introduction:-Data collection,is in fact,the most important aspect of a statistical survey.The term data used in statistics means quantitative data.In other words,indata,we include that information which is capable of numerical expression. Qualitative aspect like intelligence, honesty,good or bad has no significance in statistics until and unless these are assigned some figures. Qualitative aspects when expressed numerically can be studied in statistics
PRIMARY AND SECONDARY DATA • - Primary Data: Data collected by the investigator for his own purpose, for the first time from beginning to end, is called primary data.- Secondary Data: Seconday Data are those which are already in existence, and which have been collected, for some other purpose than the answering of the question in hand. According to wessel. “Data collected by other persons are called secondary data.”
DISTINCTION BETWEEN PRIMARY AND SECONDARY DATA • The following are the points of difference between primary and seconday data:1. Difference in Originality: Primary Data are original because these are collected bye the investigator from the source of their origin. On the other hand, secondaty data are already in existence and, therefore, are not original. Primary data are used as raw material while secondaty data are finished products.2. Difference in the suitability of objectives: Primary data are always related toa specific objective of investigator. These data, therefore, do not nned any adjustment for the concerned study. On the other hand, seconday data have already been collected for some other purpose. Therefore, this data need to be adjusted to suit the objective of study in hand.3. Difference in Cost of Collection: Primary data are costier in terms of time, money and efforts involved than the secondary data. This is because primary data are collected for the first time from their source of origin. Secondary data are simply collected from the published or unpublished reports.
METHODS OF COLLECTING PRIMARY DATA • The primary data may be collected bye using any of the following methods Direct Personal Investigation: In this method, data are collected personally by the investigator. There is a face-to-face contact with the persons from whom the information is to be pbtained. Data are collected bye asking questions relating to the enquiry to the information. SuitablityThis method is suitable particularly when:1.the field of investigation is limited;2.a greaterdegree of originality of the data is requires;3.information is to be kept secret; and 4investigation needs lots of expertise,care and devotion.
Merits • 1.Originality: Data have a high degree of originality according to this method.2.Accuracy: Data are fairly accurate when personally collected.3.Reliable: Because the information is collected bye the investigator himself, reliability may data is not doubted 4.Other information: When is direct cont with the informants, the investifator may obtain any other replated information as well.5.Uniformity: There is fair degree of uniformity in the data collected by the investigator himself from the information. Comparison becomes easy because uniformity of data
Demerits • 1. Not proper for wide areas: Direct personal investigator becomes very difficult when the area of the study is very wide.2.Personal Bias: This method is highly prone to the personal become bias of the investigator. As result, the data may lose their credibility.3.Costly: This method is very expensive in terms of the time,money and efforts evolved.4.Worng Conclusions: In this method area of investigation is generally small. The results are, therfore, less representative.This may lead to wrong conclusions.
Indirect Oral Investigator • In the method, th investigator obtains the information not from those persons for whom the information is collected orally from other persons who are expected to possess the necessary information. These other persons are known as witnesses. Indirect oral investigator is usually adopted in those cases where information through direct sources is not possible or is less reliable.
Information from local sources or correspondents • Inthis method, the investigator appoints local agents or correspondents in different places to collectinfromation. These CorrespondentsCollectthe information in their own way and send the same to the central office where the data are processed. Newspaper agencies generally adopt this method This method is also adopted by various government departments where regular information is to be collected from a wide area.
Mailed Questionnaire Method • In this method, a list of questions (known as questionnaire) relating to the survey is prepared and sent to the informants by post. The questionnaire contains questions and provides space for answers. A convering letter is addressed to the informatant explaining the object of survey and making a request to fill up the questionnaire and send it back within a specified time. Its is also assured that the information would be kept secret. The informants write the answers against the questions and return the comleted questionnaire to the ivestigator.
Schedules Filled Through Enumerators • In this method, a questionnaire is prepared as per the purpose of enquiry. The enumerator himself approaches the informant with questionnaire. The questionnaires which are filled bye the enumerators themselves by putting questions are called schedules. Thus, under this method, the enumerators himself fills the schedules after making enquries from the informants. Enumerators are those persons who help the investigators in collecting the data. The enumerators are given training to fill the schedules and put the questions intelligently in the interest of accurarcy of information.
Essentials/Qualities Of a Good Questionnaire • In the context of collection of primary data, questionnaire has special significance. A questionnaire is a list of questions relating to the field of enquiry and provides space fro answers. It may be defined as an instrument of collecting primary data from a large number of persons. The success of the investigation largely depends upon the proper drafting of the questionnaire. Following are some of notable essentials or qualities of a good questionnaire:
1.Limited number of questions: The number of questions should be as limited as possible questions should be only relating to the purpose of enquiry.2.Simplicity: Language of the questions should be simple and clear. Questions should be short and not long or completx Mathematical questions be avoided.3.Proper Order of the Questions: Questions must be placed in a proper order4.No Undesirable Questions: Undesirable questions or personal questions in particular must be avoided. The questions should not offend the informants. Questins likely to offend the personal,social and religious feelings of the informants be avoided5.Less Chance of partially:Questions should be such as can be answered impartially. No controversial questions should be asked.
Methods Of Collecting Secondary Data/Sources Of Secondary Data • The secondary data can be collected from the following two sources:(1)Published Sources(2)Unpublised Sources-Published Sources:Some of the published sources of secondary data are;1.Government Publications: Ministries of the central and state. Governments in india published a variety of statistics as their routine activity. As these are published by the government, data are fairly reliable.2.Semi-Government Publications: Semi-Government Bodies (such as Municipalities) publish data relating to education,health,births,anddeaths These data are also fairly reliable and useful.
3.Reports of Committees and Commissions: Comittees and Commissions appointed by the government also furnish lot of statistical information in their reports. Finance Commission, Monopolies Commission are some of the notable commissions in india which supply detailed statistical information in their reports.4.Publications of Trade Associations: Some of the big trade associations, through their statistical and research divisions,collect and publish data on various aspects of trading activity.5.Publications of Research Institutions: Various unversities and research institutions publish information regarding their research activities.6.Publications of Research scholars: Individual research scholars also sometimes publish their research work containing some useful statistical information.7.International Publications: Inernational organisations such as U.N.O, I.M.F, I.L.O, and foreign governments, etc., also publish lot of statistical information. These are used as secondary data
-Unpublished Sources: These are some unpublished sources as well. These data are collected by the government organisations and others, generally for their self use or office record. These data are not published . These unpublished numerical informations are, however,used as secondary data.--Precaustions In Use Of Secondary DataWe know, secondary data are collected by others to suit their specific requirements. Therefore one needs to be very carfull while using these data. Some of the notable questions to be home in mind while laying hands at the secondary data are:(a) Whether the data are reliable ?(b) Whether the data are suitable for the purpose of enquiry?(c) Whether the data are adequate ? In order to assess the reliablity, suitaiblity and adequacy of the data, Following points must be kept in mind:1.Ability of the collecting Organisation: One should check the ability of the organisation which initially collected the data. The data should be used only if collected by able, experienced and impartial investigators.
2.Objective and Scope: One should note the objective of collecting data as well as the scope of investigation. Data should be used only if objective and scope of the study undertaken earlier match with the objective and scope of the present study.3Method of Collection: The method of collection of data by the original investigator should also be noted. The method adopted must match the nature of investigatotion.4.Time and Conditions of Collection: One should also make sure regarding the period of investigation as well as the condtions of investigations.5.Definitaion of the Unit: One should also make sure that the units of measurement used in the initial collection of data is the same as adopted in the present study. If the unit of measurement differs, data must be readusted before use.6.Accuracy:Accuracy of the data should also be checked. If the available data do not conform to the high degree of accuracy.
Bye Discarding the digits entirely: Accoringsto this method,the digits, after the point to which the figurres are to be approximated, are left out entirely For example, If the figure 4,82,35,282,3759 is to be rounded up according to this method, it will be approximated like this:Upto three decimal points 43,82,35,282,375 ,, two ,, ,, ,, ,, 43,82,35,282,37 ,, one ,, ,, ,, ,, 43,82,35,282,3 ,, unit ,, ,, ,, ,, 43,82,35,282 ,, tens 43,82,35,280 ,, hundreds 43,82,35,200 ,, thousands 43,82,35,000 ,, ten thousands 43,82,30,000 ,, lakhs 43,82,00,000 ,, ten lakhs 43,80,00,000 ,, crores 43,00,00,000 Rules of Approximation (or Rounding off data) Rule I
Rule II Bye Raising the figure to the next higher figure: According to this method, the last digit is raised bye one, eliminating the rest of the digits. For Example, If figure 43,82,35,282,3759 is to be rounded up according to this method, the rounded figure will be:Upto three decimal points 43,82,35,282,376,, two ,, ,, ,, 43,82,35,282,38,, one ,, ,, ,, 43,82,35,282,4,, unit 43,82,35,283,, tens 43,82,35,290 ,, hundreds 43,82,35,000,, thousands 43,82,36,000 ,, ten thousands 43,82,40,000 ,, lakhs 43,83,00,000 ,, ten lakhs 43,90,00,000 ,, crores 44,00,00,000
Rule III Approximation to the nearest whole number: In this method, the value is unchanged when the remainder to be dropped is less than one-half, it is raised to the next higher digit, if the remainder exceeds one-half. For example, 43,82,35,282,3759 will be rounded as;Upto three decimal points 43,82,35,282,376,, two ,, ,, ,, 43,82,35,282,38,, one ,, ,, ,, 43,82,35,282,4,, unit 43,82,35,282,, tens 43,82,35,280 ,, hundreds 43,82,35,300,, thousands 43,82,35,000 ,, ten thousands 43,82,40,000 ,, lakhs 43,82,00,000 ,, ten lakhs 43,80,00,000 ,, crores 44,00,00,000
Approximation of percentages. Pecentage can also be rounded up like: