Download
1 / 35
350 likes | 787 Views
NPOESS ERA Microwave Imager . Polar Max Silver Spring, MD October 26, 2006. CMIS Replacement Trade Study Background (1/2). NPOESS Acquisition Decision Memorandum (ADM) of June 5 Called for termination of the CMIS development

E N D
NPOESS ERA Microwave Imager Polar Max Silver Spring, MD October 26, 2006
CMIS Replacement Trade Study Background (1/2) NPOESS Acquisition Decision Memorandum (ADM) of June 5 • Called for termination of the CMIS development • Directs development of a competition for a new Microwave Imager/Sounder (MIS) • Target for the new Microwave Imager/Sounder is the second EMD satellite – (C2) CMIS Replacement trade study was organized by the NPOESS IPO • Determine the best acquisition strategy for the replacement CMIS • Form a plan for going forward
CMIS Replacement Trade Study Background (2/2) Evaluate each EDR that was driving the CMIS design • Legacy Imaging • Sea Surface Wind Direction • Atmospheric Sounding • Soil Moisture and Sea Surface Temperature (Low Frequency channels) Define sensor trade space • Ten sensor configurations spanning SSM/I to CMIS capability Evaluate each part of the sensor trade space • Independent cost estimates of industry • Industry procurement strategy vs. Government procurement strategy Additional information was needed from potential industry suppliers • Request for Information was drafted and will be sent to industry • Goal of updating our assumptions and planning for a new microwave imager sounder development
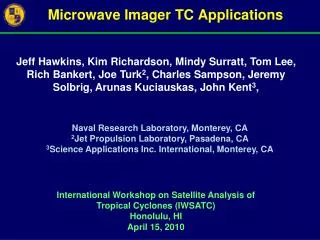
Topics Microwave Imaging Applications: SSMIS, WindSat, SSM/I, TMI CMIS Replacement (NPOESS Microwave Imager) Trade Study Acquisition Strategy for the NPOESS Era Microwave Imager
Microwave Imager/Sounder Design Drivers Imaging (SSM/I) • Atmospheric Water / Clouds • *Sea Surface Wind Speed • Sea Ice • Rain/Precipitation Sea Surface Wind Direction (WindSat) Temperature and Moisture Profiles / NWP (SSMIS) • 50/60-GHz and 166/183-GHz measurements using conical-scan geometry Sea Surface Temperature and *Soil Moisture (AMSR + WindSat) • 6- and 10-GHz V- and H-pol channels * EDRs with KPP attributes
Soil Moisture Soil Moisture Determined from AMSR Following Passage of Major Late Winter Storm Front (S. Chan, JPL) and precipitation map developed by NOAA Climatic Data Center.
WindSat Data Comparison WindSat Data Comparison with NCEP Forecast Model Showing Detection (Analysis by R. Atlas, NOAA AMOL, Ocean Sciences Conference, February 2006). NCEP analysis January 6 WindSat Surface Wind retrievals in the North Atlantic show the presence of paired cyclonic vortices not captured until the following day by the National Center for Environmental Prediction (NCEP) forecast analysis. NCEP analysis January 7
Sea Surface Temperature (I) [RIGHT] The cold wake was not seen by the visible/infrared AVHRR imager (right) due to areas of persistent rain and cloud cover (white patches) over the 3-day period. [LEFT] A cold wake (blue region near the white circles) was produced by Hurricane Bonnie on 24 to 26 August 1998, as seen by the TRMM Microwave Imager (TMI) White dots: Hurricane Bonnie’s daily position as it moved northwest from 24 through 26 August. Gray dots: Hurricane Danielle as it moved northwest from 27 August through 1 September. Danielle crossed Bonnie’s cold wake on 29 August and its intensity dropped. Cloud cover prevented AVHRR from observing this sequence, however, TMI was able to measure characteristics of the surface.
Sea Surface Temperature (II) Courtesy of Remote Sensing Systems Monthly averages for three climate state variables: 1) Sea Surface Temperature (SST), 2) Lower Tropospheric Temperature (LTT), 3) Total Atmospheric Water Vapor (WV) The seasonal cycle has been removed to reveal the inter-annual variability Continuity of Data Records is Critical for Global Climate Studies
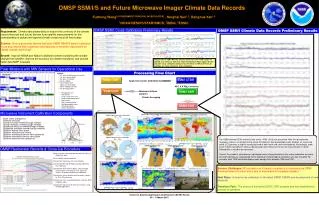
Cloud Liquid Water and Precipitable Water Atmospheric Water Vapor: 3-days ending 20060404 AMSR-E Cloud Liquid Water: 3-days ending 20060404 Water Vapor: 0 15 30 45 60 75 mm Liquid Water: 0.0 0.5 1.0 1.5 2.0 mm Global maps of total Precipitable Water and Cloud Liquid Water are produced from AMSR data on the Aqua satellite and from SSM/I and SSMIS on DMSP These datasets have value for weather forecasts and models of the energy and water cycles. Precipitable Water Vapor is considered critical for data continuity for GEOSS. Only microwave sensors can provide estimates of Cloud Liquid Water.
Precipitation Rate Rain rate (mm/h) at 2 km height from TMI. Squall line south of Japan. (From Aonashi and Liu, JAM, 2000). Rain Rate (mm/hour) Measurements of precipitation rate are valuable for tactical maneuvers, maritime navigation and fisheries dynamics. TMI provides rain rate measurements over the tropics. The addition of 166- and 183-GHz channels adds capability to measure snow and small ice.
Global degradation Ten years ago? TOVS NESDIS retrievals, AMV, more but lower quality radiosondes Impact to NWP From Loss of Data by Type (ECMWF) Impact of Microwave Data on NWP Has Significantly Increased After Saunders, R., et. al., “Exploitation of Satellite Data at the UK Met Office,” http://gmao.gsfc.nasa.gov/seminars/archive/saunders04192006.pdf
Key EDRs (*) or Group Civil Application Military Application CMS (MIS) Role Atmospheric Profiles: Temperature*, Moisture* Improved weather forecasting More reliable forecasts for mission planning Provides all-weather atmospheric profiles Cloud Imagery*, Cloud Products, Precipitation Products Nowcasts, weather events Aircraft operations, tactical planning, target visibility Provides precipitation and related cloud products Sea Surface Wind*, Sea Height/Wave Parameters Shipping safety, port/beach operations, site selection Aircraft carrier and amphibious operations Provides sea surface wind speed/direction Sea Surface Temperature*, Sea Height/Wave Parameters, Ocean Color Fisheries, pollution tracking, El Nino/La Nina forecasts Mine clearing, anti-submarine warfare, special operations Provides all weather sea surface temperature Soil Moisture*, Land/Vegetation Products Agriculture, water and land use management Mobility, trafficability, cover assessment Provides soil moisture Aerosols, Dust, and Ash Products Aviation hazards, atmospheric research Aviation hazards, target visibility Not applicable Ozone Column and Profile Products Ozone monitoring, depletion, mechanisms Ozone is related to stratospheric turbulence hazardous to UAVs Not applicable Energy Balance, Radiation Products Improved weather forecast, climate models Improved weather forecast Key input to net heat flux product Climate Relevant Products Monitoring, change, prediction Interest in medium range weather changes affecting battlefield Supplements surface, atmosphere, and cloud data products Space Environment Products Research, power grid and communication disruption Space weather, EMI, sensor damage Not applicable Use of NPOESS and Microwave EDR Products Summary of Civil and Military Applications of NPOESS Data Products
CMIS Replacement Trade Study – Highlights Soil Moisture Key Performance Parameter (KPP) • Evaluation of Soil Moisture utility based on availability of 6-GHz, 10-GHz and 19/18-GHz measurements Considerations for microwave sounding • Utility for Numerical Weather Prediction (NWP) • System reliability for delivering temperature and moisture profile KPPs Cost relationship of channel selection and reflector size • 6-GHz / larger reflector: Soil Moisture, Sea Surface Temperature • Polarimetric channels: Sea Surface Wind Direction • 50 to 60-GHz channel suite with 166/183-GHz channels: Atmospheric Temperature and Moisture Profiles • Sensor and Reflector Size relationship to cost • More room – less cost – bigger sensor? Acquisition strategy • Use models of similar successful sensor developments
Soil Moisture SSM/I and SSMIS AMSR-E [Right] Regions where Soil Moisture retrieval can be performed with the addition of a 6-GHz (and 10-GHz) measurement capability. Regions indicated by all areas that are green include regions of moderate vegetation and exclude only dense vegetation and forested regions). [Left] Current DMSP capability using SSM/I or SSMIS with the lowest channel frequency of 19.35-GHz. Areas shaded in green indicate regions where the legacy sensor is capable of detecting soil moisture, essentially areas of bare soil Addition of 6- and 10-GHz channels substantially increases the value of Soil Moisture measurements from the microwave imager
ECMWF: SSMIS Assimilation Trials Southern Hemisphere Anomaly Correlation 500hPa height • SSMIS • Pre-processed data: • 40% flagged • limited coverage • tuning ongoing • T sounding channels only • 0.5K obs errors NO SAT NO SAT + SSMIS NO SAT + N15 AMSU Graeme Kelly NH AC 500hPa height Days After Saunders, R., et. al., “Exploitation of Satellite Data at the UK Met Office,” Microrad ’06, San Juan Puerto Rico.
Temperature and Moisture Profile Data Reliability System reliability analyses indicate atmospheric temperature and moisture profile measurement capability is needed on MIS or additional ATMS need to be added to orbital planes where CMIS was the only microwave sensor previously manifested
Reflector Size Required by EDR Thresholds Reflector size (~sensor spatial resolution) and horizontal cell size (measurement resolution) relationship for selected microwave EDR threshold requirements. The Horizontal Cell Size (HCS) is based on the lowest primary channel frequency required for the measurement. Vertical bars indicate the ~reflector size necessary to meet the threshold spatial resolution for each EDR. Horizontal lines show the reflector sizes for each of the class of options within the trade space. Any vertical bar that extends above the specific horizontal line implies that the spatial resolution achieved by that sensor will not meet threshold HCS requirements for the EDR
Other Acquisition Models Sensor Development Models • Tropical Rainfall Measuring Mission (TRMM) Microwave Imager (TMI) • Reasonable cost; successful mission • Launched November, 1997 and still flying and providing data • WindSat Polarimetric Radiometer • Reasonable cost; successful mission • Launched January 6, 2003 and still flying and providing data Global Precipitation Measurement (GPM) Microwave Imager (GMI) • New and improved TMI • Sensor-based specification • Mini-competition to finalize sensor concepts • RFP and source selection • ~48 month build Characterized by complete technical and science support; “EDR” performance and analysis kept within the Government
Status of Acquisition Strategy Definition Key aspects of the MI acquisition strategy plan (proposed) • Sensor-based requirements specification • Science Algorithm development managed by the IPO; IDPS will handle only EDRs • MI sensor will be GFE to NGST Microwave Imager plan forward: • Draft a Request for Information (RFI) to Industry in order to update our industry-based cost and risk estimates • Evaluate responses • Target decision in January 2007 on roles of Government Laboratory vs. Industry build of FU1, 2 and 3 Draft Request for Information (RFI) is nearly complete • Requests cost and risk information concentrating on the middle of the acquisition trade space (1.2 m to 1.8 m)
Activities and Planning What class of microwave sensor can be built for NPOESS? • Evaluation of the RFI industry responses will help determine target sensor configuration • Complete evaluation at the end of CY 2006 • Decision on RFP expected ~January 2007 Scenarios for Microwave Imager Science Algorithms • Sensor will be GFE • Science Algorithms managed by the IPO including • IGS; University, Government Labs • Industry • Centrals responsible for Sci2Ops • NGST and IDPS receive EDRs and develops cross sensor products • Removes direct Microwave Imager performance responsibility from NGST • Path forward is still flexible
Possible MI Development Schedule (1/2) Develop RFI and evaluate affordability and contract structure • Input from legal/contracting • Decide on affordable sensor scope : GMI –> WindSAT –> CMIS • Address ‘growth potential’ • Process will start once the RFI is distributed: 1Q FY07 Sensor Specification Development (Industry Option) • Organize a specification development team (Payloads Core) • Relatively small core team with extended set of specialized contributors • De-scope the CMIS specification [2Q FY07 - 3Q FY07 ] • Joint IPO/NRL/Aero/MIT/NGST team • Industry capabilities (alignment of industry capability with spec) • Algorithm (Science) support - IGS and industry (RSS/AER) • Formulate a study contract with industry [ 3Q FY07 – 4Q FY07 ] • Competition (2 – 3 Month period of performance) • Each participant briefs sensor concept at the end of the study (one day)
Possible MI Development Schedule (2/2) Algorithm Specification and Science Code Development • Algorithm Strategy definition [ 1Q FY07 – 2Q FY07 ] • Consensus achieved on development strategy • Algorithm strategy definition determined prior to A-level MI sensor spec. • Analysis supporting MI specification development [2Q FY07 – 1Q FY08] MI Sensor Development (Industry or Government-Industry) (TBD) • RFP Development [ 1Q FY08 ] • Proposal Evaluation and award [3Q FY08 – 4Q FY08] • Baseline Developed: 2Q FY09 • SRR (3QFY09) • PDR (1QFY10) • CDR (1QFY11) • Delivery (3QFY14) • Margin: ~2 years
Summary The replacement trade study considered EDR performance, Cost and Schedule from several perspectives Terminating CMIS and restructuring the way NPOESS does business for the CMIS replacement will be a challenge Restructuring is a means to address and mitigate previous procurement risks An acquisition strategy decision for the NPOESS Microwave Imager is expected by January 2007 Microwave imager is a key part of NPOESS!
Sea Ice Concentration and Ice Edge from SSMIS Northern Hemisphere Ice Edge Southern Hemisphere Ice Edge
CMIS Replacement Trade Study – Still in Progress Overview and background on microwave imager data Channels required to make the measurements • Sensor characteristics required • Sensor design required to accommodate capability Defined a sensor trade space • Ten separate configurations: [SSM/I to CMIS] Developed independent cost estimates Estimated cost compared to capability • 6-GHz / larger reflector: SM; SST measurements • Polarimetric channels: Sea Surface Wind Direction • 50 to 60-GHz channel suite with 166/183-GHz channels: Atmospheric Temperature and Moisture Profiles Additional consideration for microwave sounding • Reliability Acquisition strategy • Request for Information (RFI)
CMIS Sensor Low Frequency Reflector High Frequency Reflector Cold Sky Reflector Warm Load Low Frequency Feeds High Frequency Feeds
CMIS Channel Set and Characteristics * *Polarizations: V=Vertical, H=Horizontal, P=+45 degrees, M =–45 degrees, L=Left-hand Circular, R=Right-hand Circular