Download
1 / 47
470 likes | 621 Views
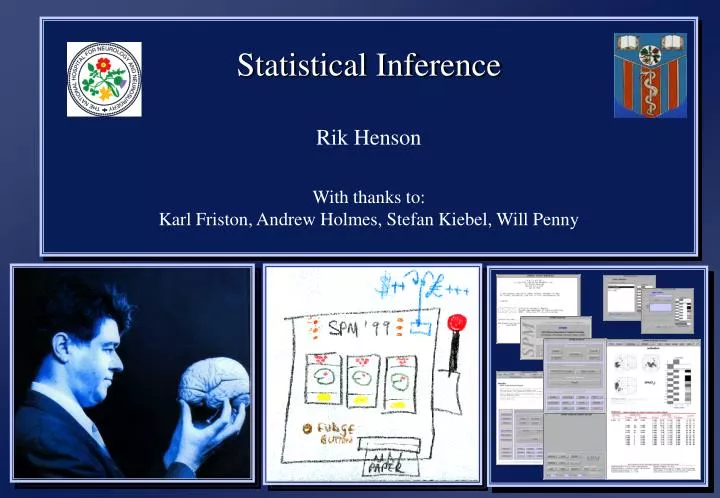
Statistical Inference Rik Henson With thanks to: Karl Friston, Andrew Holmes, Stefan Kiebel, Will Penny. Statistical Parametric Map. Design matrix. fMRI time-series. kernel. Motion correction. Smoothing. General Linear Model. Spatial normalisation. Parameter Estimates. Standard

E N D
Statistical Inference Rik Henson With thanks to: Karl Friston, Andrew Holmes, Stefan Kiebel, Will Penny
Statistical Parametric Map Design matrix fMRI time-series kernel Motion correction Smoothing General Linear Model Spatial normalisation Parameter Estimates Standard template Overview
Overview 1. General Linear Model Design Matrix Global normalisation 2. fMRI timeseries Highpass filtering HRF convolution Temporal autocorrelation 3. Statistical Inference Gaussian Field Theory 4. Random Effects 5. Experimental Designs 6. Effective Connectivity
SPM{t} Eg random noise pu = 0.05 Gaussian10mm FWHM (2mm pixels) Multiple comparisons… • If n=100,000 voxels tested with pu=0.05 of falsely rejecting Ho... …then approx n pu (eg 5,000) will do so by chance (false positives, or “type I” errors) • Therefore need to “correct” p-values for number of comparisons • A severe correction would be a Bonferroni, where pc = pu /n… …but this is only appropriate when the n tests independent… … SPMs are smooth, meaning that nearby voxels are correlated => Gaussian Field Theory...
Consider SPM as lattice representation of continuous random field “Euler characteristic” - topological measure of “excursion set” (e.g,# components - # “holes”) Gaussian Field Theory • Smoothness estimated by covariance of partial derivatives of residuals (expressed as “resels” or FWHM) • Assumes: 1) residuals are multivariate normal 2) smoothness » voxel size (practically, FWHM 3 VoxDim) • Not necessarily stationary: smoothness estimated locally as resels-per-voxel
Generalised Form • General form for expected Euler characteristic for D dimensions: E[(WAu)] = S Rd (W)rd (u) Rd (W): d-dimensional Minkowski – function of dimension, d, spaceWand smoothness: R0(W) = (W) Euler characteristic of W R1(W) = resel diameter R2(W) = resel surface area R3(W) = resel volume rd (W): d-dimensional EC density of Z(x) – function of dimension, d, threshold, u, and statistic, e.g. Z-statistic: r0(u) = 1- (u) r1(u) = (4 ln2)1/2 exp(-u2/2) / (2p) r2(u) = (4 ln2) exp(-u2/2) / (2p)3/2 r3(u) = (4 ln2)3/2 (u2 -1) exp(-u2/2) / (2p)2 r4(u) = (4 ln2)2 (u3 -3u) exp(-u2/2) / (2p)5/2
Three levels of inference: extreme voxel values voxel-levelinference big suprathreshold clusters cluster-levelinference many suprathreshold clusters set-levelinference voxel-level: P(t 4.37) = .048 n=12 n=82 n=32 cluster-level:P(n 82, t u) = 0.029 set-level:P(c 3, n k, t u) = 0.019 Levels of Inference Omnibus:P(c 7, t u) = 0.031 Parameters: “Height” threshold, u - t > 3.09 “Extent” threshold, k - 12 voxels Dimension, D - 3 Volume, S - 323 voxels Smoothness, FWHM - 4.7 voxels
If have an a priori region of interest, no need to correct for whole-brain! But can use GFT to correct for a Small Volume (SVC) Volume can be based on: An anatomically-defined region A geometric approximation to the above (eg rhomboid/sphere) A functionally-defined mask (based on an ORTHOGONAL contrast!) Extent of correction can be APPROXIMATED by a Bonferonni correction for the number of resels… ..but correction also depends on shape (surface area) as well as size (volume) of region (may want to smooth volume if rough) Small-volume correction
Overview 1. General Linear Model Design Matrix Global normalisation 2. fMRI timeseries Highpass filtering HRF convolution Temporal autocorrelation 3. Statistical Inference Gaussian Field Theory 4. Random Effects 5. Experimental Designs 6. Effective Connectivity
Multi-subject Fixed Effect model Subject 1 error df ~ 300 Subject 2 Subject 3 Subject 4 Subject 5 Subject 6 Fixed vs. Random Effects • Subjects can be Fixed or Random variables • If subjects are a Fixed variable in a single design matrix (SPM “sessions”), the error term conflates within- and between-subject variance • In PET, this is not such a problem because the within-subject (between-scan) variance can be as great as the between-subject variance; but in fMRI the between-scan variance is normally much smaller than the between-subject variance • If one wishes to make an inference from a subject sample to the population, one needs to treat subjects as a Random variable, and needs a proper mixture of within- and between-subject variance • In SPM, this is achieved by a two-stage procedure: • 1) (Contrasts of) parameters are estimated from a (Fixed Effect) model for each subject • 2) Images of these contrasts become the data for a second design matrix (usually simple t-test or ANOVA)
1st-level (within-subject) 2nd-level (between-subject) One-sample t-test N=6 subjects (error df =5) ^ b1 ^ 1 ^ b2 ^ 2 contrast images of cbi ^ b3 p < 0.001 (uncorrected) ^ 3 ^ SPM{t} b4 ^ bpop ^ 4 ^ b5 WHEN special case of n independent observations per subject: var(bpop) = 2b/ N+2w/ Nn ^ 5 ^ b6 ^ 6 ^ w= within-subject error Two-stage “Summary Statistic” approach
New in SPM2 Limitations of 2-stage approach • Summary statistic approach is a special case, valid only when each subject’s design matrix is identical (“balanced designs”) • In practice, the approach is reasonably robust to unbalanced designs (Penny, 2004) • More generally, exact solutions to any hierarchical GLM can be obtained using ReML • This is computationally expensive to perform at every voxel (so not implemented in SPM2) • Plus modelling of nonsphericity at 2nd-level can minimise potential bias of unbalanced designs…
New in SPM2 Inhomogeneous variance (3 groups of 4 subjects) 1 2 3 Q Repeated measures (3 groups of 4 subjects) Q Nonsphericity again! • When tests at 2nd-level are more complicated than 1/2-sample t-tests, errors can be non i.i.d • For example, two groups (e.g, patients and controls) may have different variances (non-identically distributed; inhomogeniety of variance) • Or when taking more than one parameter per subject (repeated measures, e.g, multiple basis functions in event-related fMRI), errors may be non-independent • (If nonsphericity correction selected, inhomogeniety assumed, and further option for repeated measures) • Same method of variance component estimation with ReML (that used for autocorrelation) is used • (Greenhouse-Geisser correction for repeated-measures ANOVAs is a special case approximation)
New in SPM2 Hierarchical Models • Two-stage approach is special case of Hierarchical GLM • In a Bayesian framework, parameters of one level can be made priors on distribution of parameters at lower level: “Parametric Empirical Bayes” (Friston et al, 2002) • The parameters and hyperparameters at each level can be estimated using EM algorithm (generalisation of ReML) • Note parameters and hyperparameters at final level do not differ from classical framework • Second-level could be subjects; it could also be voxels… y = X(1) (1) + e(1) (1)= X(2)(2) + e(2) … (n-1)= X(n)(n) + e(n) Ce(i) = k(i)Qk(i)
New in SPM2 Parametric Empirical Bayes & PPMs • Bayes rule: p(|y) = p(y|) p() Posterior Likelihood Prior (PPM) (SPM) • What are the priors? • In “classical” SPM, no (flat) priors • In “full” Bayes, priors might be from theoretical arguments, or from independent data • In “empirical” Bayes, priors derive from same data, assuming a hierarchical model for generation of that data
New in SPM2 Classical T-test Bayesian test Parametric Empirical Bayes & PPMs • Bayes rule: p(|y) = p(y|) p() Posterior Likelihood Prior (PPM) (SPM) • For PPMs in SPM2, priors come from distribution over voxels • If remove mean over voxels, prior mean can be set to zero (a “shrinkage” prior) • One can threshold posteriors for a given probability of a parameter estimate greater than some value … • …to give a posterior probability map (PPM)
New in SPM2 Parametric Empirical Bayes & PPMs • Activations greater than certain amount Voxels with non-zero activations • Can infer no responses Cannot “prove the null hypothesis” • No fallacy of inference Fallacy of inference (large df) • Inference independent of search volume Correct for search volume • Computationally expensive Computationally faster
Overview 1. General Linear Model Design Matrix Global normalisation 2. fMRI timeseries Highpass filtering HRF convolution Temporal autocorrelation 3. Statistical Inference Gaussian Field Theory 4. Random Effects 5. Experimental Designs 6. Effective Connectivity
A taxonomy of design • Categorical designs • Subtraction - Additive factors and pure insertion • Conjunction - Testing multiple hypotheses • Parametric designs • Linear - Cognitive components and dimensions • Nonlinear - Polynomial expansions • Factorial designs • Categorical - Interactions and pure insertion • - Adaptation, modulation and dual-task inference • Parametric - Linear and nonlinear interactions • - Psychophysiological Interactions
A taxonomy of design • Categorical designs • Subtraction - Additive factors and pure insertion • Conjunction - Testing multiple hypotheses • Parametric designs • Linear - Cognitive components and dimensions • Nonlinear - Polynomial expansions • Factorial designs • Categorical - Interactions and pure insertion • - Adaptation, modulation and dual-task inference • Parametric - Linear and nonlinear interactions • - Psychophysiological Interactions
A categorical analysis Experimental design Word generation G Word repetition R R G R G R G R G R G R G G - R = Intrinsic word generation …under assumption of pure insertion, ie, that G and R do not differ in other ways
A taxonomy of design • Categorical designs • Subtraction - Additive factors and pure insertion • Conjunction - Testing multiple hypotheses • Parametric designs • Linear - Cognitive components and dimensions • Nonlinear - Polynomial expansions • Factorial designs • Categorical - Interactions and pure insertion • - Adaptation, modulation and dual-task inference • Parametric - Linear and nonlinear interactions • - Psychophysiological Interactions
Task (1/2) Viewing Naming A1 A2 Objects Colours Stimuli (A/B) B1 B2 Common object recognition response (R) Price et al, 1997 Cognitive Conjunctions • One way to minimise problem of pure insertion is to isolate same process in several different ways (ie, multiple subtractions of different conditions) Visual Processing V Object Recognition R Phonological Retrieval P Object viewing R,V Colour viewing V Object naming P,R,V Colour naming P,V (Object - Colour viewing) [1 -1 0 0] & (Object - Colour naming) [0 0 1 -1] [ R,V - V ] & [ P,R,V - P,V ] = R & R = R (assuming RxP = 0; see later)
New in SPM2 p((A1-A2)= (B1-B2))>P2 + B1-B2 p(A1=A2+B1=B2)<P1 A1-A2 p(A1=A2)<p B1-B2 + p(B1=B2)<p A1-A2 Cognitive Conjunctions • Original (SPM97) definition of conjunctions entailed sum of two simple effects (A1-A2 + B1-B2) plus exclusive masking with interaction (A1-A2) - (B1-B2) • Ie, “effects significant and of similar size” • (Difference between conjunctions and masking is that conjunction p-values reflect the conjoint probabilities of the contrasts) • SPM2 defintion of conjunctions uses advances in Gaussian Field Theory (e.g, T2 fields), allowing corrected p-values • However, the logic has changed slightly, in that voxels can survive a conjunction even though they show an interaction
A taxonomy of design • Categorical designs • Subtraction - Additive factors and pure insertion • Conjunction - Testing multiple hypotheses • Parametric designs • Linear - Cognitive components and dimensions • Nonlinear - Polynomial expansions • Factorial designs • Categorical - Interactions and pure insertion • - Adaptation, modulation and dual-task inference • Parametric - Linear and nonlinear interactions • - Psychophysiological Interactions
Quadratic Linear SPM{F} Nonlinear parametric responses E.g, F-contrast [0 1 0] on Quadratic Parameter => Inverted ‘U’ response to increasing word presentation rate in the DLPFC Polynomial expansion: f(x) ~ b1 x + b2 x2 + ... …(N-1)th order for N levels
A taxonomy of design • Categorical designs • Subtraction - Additive factors and pure insertion • Conjunction - Testing multiple hypotheses • Parametric designs • Linear - Cognitive components and dimensions • Nonlinear - Polynomial expansions • Factorial designs • Categorical - Interactions and pure insertion • - Adaptation, modulation and dual-task inference • Parametric - Linear and nonlinear interactions • - Psychophysiological Interactions
Task (1/2) Viewing Naming A1 A2 Objects Colours Stimuli (A/B) B1 B2 Naming-specific object recognition Object - Colour viewing naming Interactions and pure insertion • Presence of an interaction can show a failure of pure insertion (using earlier example)… Visual Processing V Object Recognition R Phonological Retrieval P Object viewing R,V Colour viewing V Object naming P,R,V,RxP Colour naming P,V (Object – Colour) x (Viewing – Naming) [1 -1 0 0] - [0 0 1 -1] = [1 -1] [1 -1] = [1 -1 -1 1] [ R,V - V ] - [ P,R,V,RxP - P,V ] = R – R,RxP = RxP
A taxonomy of design • Categorical designs • Subtraction - Additive factors and pure insertion • Conjunction - Testing multiple hypotheses • Parametric designs • Linear - Cognitive components and dimensions • Nonlinear - Polynomial expansions • Factorial designs • Categorical - Interactions and pure insertion • - Adaptation, modulation and dual-task inference • Parametric - Linear and nonlinear interactions • - Psychophysiological Interactions
SPM{Z} Attention V1 V5 Psycho-physiological Interaction (PPI) Parametric, factorial design, in which one factor is psychological (eg attention) ...and other is physiological(viz. activity extracted from a brain region of interest) V1 activity time attention V5 activity no attention Attentional modulation of V1 - V5 contribution V1 activity
New in SPM2 Psycho-physiological Interaction (PPI) • PPIs tested by a GLM with form: y = (V1A).b1 + V1.b2 + A.b3 + e c = [1 0 0] • However, the interaction term of interest, V1A, is the product of V1 activity and Attention block AFTER convolution with HRF • We are really interested in interaction at neural level, but: (HRF V1) (HRF A) HRF (V1 A) (unless A low frequency, eg, blocked; so problem for event-related PPIs) • SPM2 can effect a deconvolution of physiological regressors (V1), before calculating interaction term and reconvolving with the HRF • Deconvolution is ill-constrained, so regularised using smoothness priors (using ReML)
Overview 1. General Linear Model Design Matrix Global normalisation 2. fMRI timeseries Highpass filtering HRF convolution Temporal autocorrelation 3. Statistical Inference Gaussian Field Theory 4. Random Effects 5. Experimental Designs 6. Effective Connectivity
0.49 B A -0.02 Functional connectivity 2=0.5, ns. 0.31 C Effective connectivity Effective vs. functional connectivity Correlations: A B C 1 0.49 1 0.30 0.12 1 No connection between B and C, yet B and C correlated because of common input from A, eg: A = V1 fMRI time-series B = 0.5 * A + e1 C = 0.3 * A + e2
New in SPM2 Dynamic Causal Modelling • PPIs allow a simple (restricted) test of effective connectivity • Structural Equation Modelling is more powerful (Buchel & Friston, 1997) • However in SPM2, Dynamic Causal Modelling (DCM) is preferred • DCMs are dynamic models specified at the neural level • The neural dynamics are transformed into predicted BOLD signals using a realistic biological haemodynamic forward model (HDM) • The neural dynamics comprise a deterministic state-space model and a bilinear approximation to model interactions between variables
New in SPM2 direct inputs- u1 (e.g. visual stimuli) contextual inputs - u2 (e.g. attention) . z = f(z,u,z) Az + uBz + Cu y = h(z,h) + e z = state vector u = inputs = parameters (connection/haemodynamic) Dynamic Causal Modelling • The variables consist of: connections between regions self-connections direct inputs (eg, visual stimulations) contextual inputs (eg, attention) • Connections can be bidirectional • Variables estimated using EM algorithm • Priors are: empirical (for haemodynamic model) principled (dynamics to be convergent) shrinkage (zero-mean, for connections) • Inference using posterior probabilities • Methods for Bayesian model comparison z3 SPC z1 V1 z2 V5 y2 y3 y1
New in SPM2 Dynamic Causal Modelling stimuli u1 context u2 u1 - + - Z1 u2 + z1 + Z2 - z2 -
New in SPM2 SPC Attention V1 IFG Photic V5 .52 (98%) .37 (90%) .42 (100%) .56 (99%) .69 (100%) .47 (100%) .82 (100%) Motion Effects Photic – dots vs fixation Motion – moving vs static Attenton – detect changes .65 (100%) Friston et al. (2003) • Attention modulates the backward-connections IFG→SPC and SPC→V5 • The intrinsic connection V1→V5 is insignificant in the absence of motion Dynamic Causal Modelling Büchel & Friston (1997)
Some References Friston KJ, Holmes AP, Worsley KJ, Poline J-B, Frith CD, Frackowiak RSJ (1995) Statistical parametric maps in functional imaging: A general linear approach” Human Brain Mapping 2:189-210 Worsley KJ & Friston KJ (1995) Analysis of fMRI time series revisited — again” NeuroImage 2:173-181 Friston KJ, Josephs O, Zarahn E, Holmes AP, Poline J-B (2000) “To smooth or not to smooth” NeuroImage Zarahn E, Aguirre GK, D'Esposito M (1997) “Empirical Analyses of BOLD fMRI Statistics” NeuroImage 5:179-197 Holmes AP, Friston KJ (1998) “Generalisability, Random Effects & Population Inference” NeuroImage 7(4-2/3):S754 Worsley KJ, Marrett S, Neelin P, Evans AC (1992) “A three-dimensional statistical analysis for CBF activation studies in human brain”Journal of Cerebral Blood Flow and Metabolism 12:900-918 Worsley KJ, Marrett S, Neelin P, Vandal AC, Friston KJ, Evans AC (1995) “A unified statistical approach for determining significant signals in images of cerebral activation” Human Brain Mapping 4:58-73 Friston KJ, Worsley KJ, Frackowiak RSJ, Mazziotta JC, Evans AC (1994) Assessing the Significance of Focal Activations Using their Spatial Extent” Human Brain Mapping 1:214-220 Cao J (1999) The size of the connected components of excursion sets of 2, t and F fields” Advances in Applied Probability (in press) Worsley KJ, Marrett S, Neelin P, Evans AC (1995) Searching scale space for activation in PET images” Human Brain Mapping 4:74-90 Worsley KJ, Poline J-B, Vandal AC, Friston KJ (1995) Tests for distributed, non-focal brain activations” NeuroImage 2:183-194 Friston KJ, Holmes AP, Poline J-B, Price CJ, Frith CD (1996) Detecting Activations in PET and fMRI: Levels of Inference and Power” Neuroimage 4:223-235
PCA/SVD and Eigenimages A time-series of 1D images 128 scans of 32 “voxels” Expression of 1st 3 “eigenimages” Eigenvalues and spatial “modes” The time-series ‘reconstituted’
V1 V2 V3 voxels APPROX. OF Y U1 U2 APPROX. OF Y U3 APPROX. OF Y s1 + s2 + s3 = Y (DATA) time PCA/SVD and Eigenimages + ... Y = USVT = s1U1V1T + s2U2V2T + ...
Time x Condition interaction Time x condition interactions (i.e. adaptation) assessed with the SPM{T}
z z 2 1 3 z Structural Equation Modelling (SEM) Minimise the difference between the observed (S) and implied () covariances by adjusting the path coefficients (B) The implied covariance structure: x = x.B + zx = z.(I - B)-1 x : matrix of time-series of Regions 1-3 B: matrix of unidirectional path coefficients Variance-covariance structure: xT . x = = (I-B)-T. C.(I-B)-1 where C = zT z xT.x is the implied variance covariance structure C contains the residual variances (u,v,w) and covariances The free parameters are estimated by minimising a [maximum likelihood] function of S and
0.43 0.75 0.47 0.76 Attention - No attention No attention Attention Changes in “effective connectivity”
2 =11, p<0.01 PP V1 0.14 V5 V1xPP V5 Second-order Interactions = Modulatory influence of parietal cortex on V1 to V5