Download
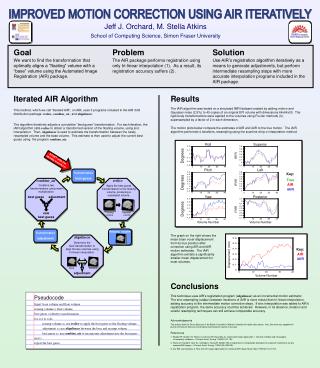
1 / 1
10 likes | 130 Views
Jeff J. Orchard, M. Stella Atkins. School of Computing Science, Simon Fraser University. where holds the 6 motion parameters. For small motions, the transformation can be linearly approximated by,. Superior. Roll. Activation Level. +. Degrees. mm. 10. 10. 20. 20. 30. 30.

E N D
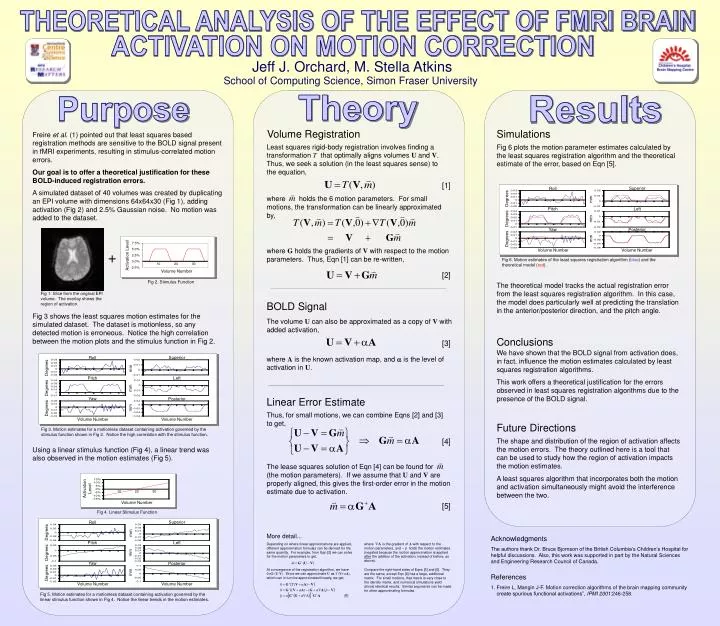
Jeff J. Orchard, M. Stella Atkins School of Computing Science, Simon Fraser University where holds the 6 motion parameters. For small motions, the transformation can be linearly approximated by, Superior Roll Activation Level + Degrees mm 10 10 20 20 30 30 Volume Number Pitch Left Degrees Fig 2. Stimulus Function Superior mm Roll Fig 6. Motion estimates of the least squares registration algorithm (blue) and the theoretical model (red). Degrees Yaw Posterior mm Fig 1. Slice from the original EPI volume. The overlay shows the region of activation. mm Degrees Pitch Left Degrees mm Volume Number Volume Number Fig 3. Motion estimates for a motionless dataset containing activation governed by the stimulus function shown in Fig 2. Notice the high correlation with the stimulus function. Yaw Posterior mm Degrees Volume Number Volume Number The lease squares solution of Eqn [4] can be found for (the motion parameters). If we assume that U and V are properly aligned, this gives the first-order error in the motion estimate due to activation. Activation Level Volume Number Fig 4. Linear Stimulus Function Superior Roll Degrees mm Pitch Left Degrees mm More detail... where is the gradient of A with respect to the motion parameters, and holds the motion estimates (negated because the motion approximation is applied after the addition of the activation, instead of before, as above). Depending on where linear approximations are applied, different approximation formulas can be derived for the same quantity. For example, from Eqn [2] we can solve for the motion parameters to get, Yaw Posterior mm Degrees Volume Number Volume Number At convergence of the registration algorithm, we have 0G+(U-V). Since we can approximate U as T (V+A), which can in turn be approximated linearly, we get, Compare the right-hand sides of Eqns [5] and [6]. They are the same, except Eqn [6] has a large, additional matrix. For small motions, that matrix is very close to the identity matrix, and numerical simulations yield almost identical results. Similar arguments can be made for other approximating formulas. [6] THEORETICAL ANALYSIS OF THE EFFECT OF FMRI BRAIN ACTIVATION ON MOTION CORRECTION Theory Results Purpose Volume Registration Simulations Freire et al. (1) pointed out that least squares based registration methods are sensitive to the BOLD signal present in fMRI experiments, resulting in stimulus-correlated motion errors. Least squares rigid-body registration involves finding a transformation T that optimally aligns volumes U and V. Thus, we seek a solution (in the least squares sense) to the equation, Fig 6 plots the motion parameter estimates calculated by the least squares registration algorithm and the theoretical estimate of the error, based on Eqn [5]. Our goal is to offer a theoretical justification for these BOLD-induced registration errors. [1] A simulated dataset of 40 volumes was created by duplicating an EPI volume with dimensions 64x64x30 (Fig 1), adding activation (Fig 2) and 2.5% Gaussian noise. No motion was added to the dataset. where G holds the gradients of V with respect to the motion parameters. Thus, Eqn [1] can be re-written, [2] The theoretical model tracks the actual registration error from the least squares registration algorithm. In this case, the model does particularly well at predicting the translation in the anterior/posterior direction, and the pitch angle. BOLD Signal Fig 3 shows the least squares motion estimates for the simulated dataset. The dataset is motionless, so any detected motion is erroneous. Notice the high correlation between the motion plots and the stimulus function in Fig 2. The volume U can also be approximated as a copy of V with added activation, Conclusions [3] We have shown that the BOLD signal from activation does, in fact, influence the motion estimates calculated by least squares registration algorithms. This work offers a theoretical justification for the errors observed in least squares registration algorithms due to the presence of the BOLD signal. where A is the known activation map, and is the level of activation in U. Linear Error Estimate Thus, for small motions, we can combine Eqns [2] and [3] to get, Future Directions [4] The shape and distribution of the region of activation affects the motion errors. The theory outlined here is a tool that can be used to study how the region of activation impacts the motion estimates. A least squares algorithm that incorporates both the motion and activation simultaneously might avoid the interference between the two. Using a linear stimulus function (Fig 4), a linear trend was also observed in the motion estimates (Fig 5). [5] Acknowledgments The authors thank Dr. Bruce Bjornson of the British Columbia’s Children’s Hospital for helpful discussions. Also, this work was supported in part by the Natural Sciences and Engineering Research Council of Canada. References 1. Freire L, Mangin J-F. Motion correction algorithms of the brain mapping community create spurious functional activations”, IPMI 2001:246-258. Fig 5. Motion estimates for a motionless dataset containing activation governed by the linear stimulus function shown in Fig 4. Notice the linear trends in the motion estimates.