html5-img
1 / 0

2012 Utah Statewide Household Travel Study

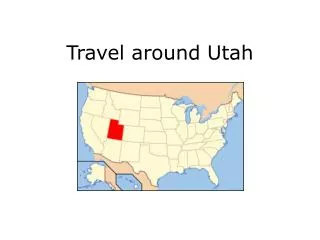
2012 Utah Statewide Household Travel Study. Study Overview. 2012 Utah Travel Study. Purpose of Utah Travel Study. Better understand travel patterns & travel needs of Utah residents

rich
Download Presentation

2012 Utah Statewide Household Travel Study

An Image/Link below is provided (as is) to download presentation Download Policy: Content on the Website is provided to you AS IS for your information and personal use and may not be sold / licensed / shared on other websites without getting consent from its author. Content is provided to you AS IS for your information and personal use only. Download presentation by click this link. While downloading, if for some reason you are not able to download a presentation, the publisher may have deleted the file from their server. During download, if you can't get a presentation, the file might be deleted by the publisher.

E N D

Presentation Transcript


  1. 2012 Utah StatewideHousehold Travel Study

    Study Overview
  2. 2012 Utah Travel Study Purpose of Utah Travel Study Better understand travel patterns & travel needs of Utah residents Understanding daily travel patterns in the area is vital for responsible planning of future transportation projects
  3. Necessary Data: Travel Data Trips made over 24-hour period by all adults and children over 5 Data includes – trip origin/destination, travel times, trip purpose, travel mode, occupancy, etc. Household Travel Diary Study: Data Collected
  4. Motivation for the 2012 Utah Travel Study Understanding Public Opinion and Attitudes Spending priorities Land-use & transportation Non-motorized travel Understanding Travel Demand & Travel Modeling Where people travel Why people travel When people travel 2 Primary Uses for the Data
  5. Using the Results from the Utah Travel Study

  6. Understanding Public Opinion/Attitudes Priorities Should we spend first on maintenance or expansion? Should we facilitate land-use growth in new areas or focus on redevelopment and infill? Housing & Transportation Actual vs. ideal housing types Which transportation factors are important to people when choosing a place to live? Non-motorized Travel What portion of the population owns and is healthy enough to use a bike? Perceptions around infrastructure Additional Motivation for the 2012 Utah Travel Study
  7. Statewide Priorities High Priority Low Priority Note: *The rankings for these priorities are a virtual tie in the data Preferences suggest focusing on current facilities
  8. Statewide Attitudes: Taxation Stark Regional Differences Regarding Taxation “I would be willing to pay higher taxes in order to build a transportation system that resulted in less traffic congestion” Net Willingness to Pay Taxes – Difference between the portion of sample who agree and disagree with the above statement (green is more willing) Note: *UDOT = rural counties not included in the other regions
  9. Statewide Attitudes: Economic Growth Approximately 5 to 1 support for the notion that transportation helps drive Utah’s economy “Improving the transportation system would improve the economy”
  10. Statewide Attitudes: Land-Use There appears to be support for concurrency between improving the transportation system and land-use growth Complex opinions around land-use and transportation 48% agree and 14% disagree that LU/transportation should be more coordinated even if it means limiting land-use choices 40% agree and 22% disagree that a top transportation priority should be to improve access to new areas for development Statements seem to suggest that transportation and land-use decisions should be coordinated to facilitate development Clear alignment around some points 60% agree and only 8% disagree that improved connectivity of streets and sidewalks should be a priority to support more direct travel 58% agree and only 7% disagree that a top transportation priority should be to promote infill/redevelopment
  11. Regional Trip Generation Rate Comparison Dixie has lower trips/HH due to lower Avg HH Size 1993 Survey had slightly higher trip rates
  12. Potential Model Enhancement: Market Segmentation The current model is segmented by auto ownership and HH size, primarily. Other variables such as income, workers and age will be considered. This example uses a life cycle variable.
  13. Average Trip Length Comparison Cache and Dixie have the lowest reported average trip length 1993 Survey had higher reported trip times Most likely due to how trips were reported
  14. Potential Model Enhancements: VMT per HH, by geography People in suburban and rural areas generally drive more.
  15. Compare Mode Shares by Region
  16. Mode Share – Dixie
  17. Dixie: Key Transit-Related Attitudes Current attitudes towards transit system suggest it will be difficult to attract riders Driving is not perceived as onerous 67% feel that traffic congestion is not a major problem, and only 18% feel it is (4 to 1) People are not thinking about transit as an option 80% admit to not making an effort to use transit, and only 4% agree (20 to 1) People cannot take transit to most locations 67% feel transit cannot get them where they need to travel, and only 9% feel otherwise (7 to 1)
  18. Dixie: Key Transit-Related Attitudes Current attitudes towards transit system suggest it will be difficult to improve the system Significant improvements cost money 56% are opposed to raising taxes to fund transit investments, and only 19% are in favor (3 to 1) 48% are opposed to raising taxes to “reduce congestion”, and only 25% are in favor (2 to 1 oppose the idea, which is the highest opposition in the State) Increased mode choice is the lowest of the “5 priorities” 62% of the respondents ranked greater mode choice in the bottom 2 (worst of any of the 5 potential priorities)
  19. Dixie: Key Transit-Related Attitudes The silver lining. There are ways to improve the system Expand network (45%) Airport service (32%) Increased frequency (29%) Free service (28%) Zion service (26%) Increased speed (21%) 31% of respondents said “none of the above”, which is not a surprise. The surprise is 69% chose one of the above. 35% agreed they would be willing to drive less with better transit, while 40% disagreed. The ultimate question is, how much is needed to get “better transit”?
  20. Household Travel Study: Bike/Ped Debrief Presence of sidewalks & bike paths: Overall 60% of respondents think there are enough sidewalks in their region Lower agreement about adequacy of bike paths.
  21. Household Travel Study: Bike/Ped Debrief Bike attitude statements: High support for funding new sidewalks/bike paths Notable compared to Dixie’s lack of support for funding transit Similarly high agreement (63% overall) that walking/biking places in own neighborhood is important
More Related