Download
1 / 53
660 likes | 1.16k Views
Introduction to Hypothesis Testing. Chapter 11. Developing Null and Alternative Hypotheses. Hypothesis testing can be used to determine whether a statement about the value of a population parameter should or should not be rejected.

E N D
Introduction to Hypothesis Testing Chapter 11
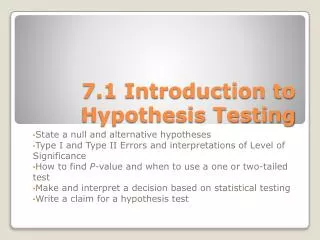
Developing Null and Alternative Hypotheses • Hypothesis testing can be used to determine whether a statement about the value of a population parameter should or should not be rejected. • The null hypothesis, denoted by H0 , is a tentative assumption about a population parameter. • The alternative hypothesis, denoted by H1, is the opposite of what is stated in the null hypothesis. • Hypothesis testing is similar to a criminal trial. The hypotheses are: H0: The defendant is innocent H1: The defendant is guilty
A Summary of Forms for Null and Alternative Hypotheses about a Population Mean • The equality part of the hypotheses always appears in the null hypothesis. • In general, a hypothesis test about the value of a population mean must take one of the following three forms (where 0 is the hypothesized value of the population mean). H0: >0 H0: <0 H0: = 0 H1: < 0 H1: > 0 H1: 0
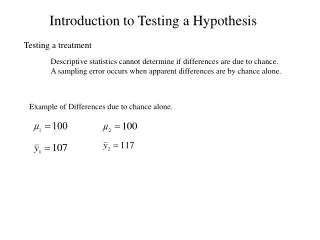
Concepts of Hypothesis Testing • The critical concepts of hypothesis testing. • Example: • An operation manager needs to determine if the mean demand during lead time is greater than 350. • If so, changes in the ordering policy are needed. • There are two hypotheses about a population mean: • H0: The null hypothesis m = 350 • H1: The alternative hypothesis m > 350 This is what you want to prove
Concepts of Hypothesis Testing • Assume the null hypothesis is true (m= 350). m = 350 • Sample from the demand population, and build a statistic related to the parameter hypothesized (the sample mean). • Pose the question: How probable is it to obtain a sample mean at least as extreme as the one observed from the sample, if H0 is correct?
Since the is much larger than 350, the mean m is likely to be greater than 350. Reject the null hypothesis. Concepts of Hypothesis Testing • Assume the null hypothesis is true (m= 350). m = 350 • In this case the mean m is not likely to be greater than 350. Do not reject the null hypothesis.
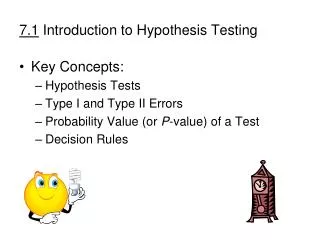
Types of Errors • Two types of errors may occur when deciding whether to reject H0 based on the statistic value. • Type I error: Reject H0 when it is true. • Type II error: Do not reject H0 when it is false. • Example continued • Type I error: Reject H0 (m = 350) in favor of H1 (m > 350) when the real value of m is 350. • Type II error: Believe that H0 is correct (m = 350) when the real value of m is greater than 350.
Type I and Type II Errors • Since hypothesis tests are based on sample data, we must allow for the possibility of errors. • The person conducting the hypothesis test specifies the maximum allowable probability of making a Type I error, denoted by and called the level of significance. • Generally, we cannot control for the probability of making a Type II error, denoted by . • Statistician avoids the risk of making a Type II error by using “do not reject H0” and not “accept H0”.
Null True Null False Fail to Correct Type II error reject null Decision ( ) Reject null Type I error Correct Decision (Power) ( ) Decision Table for Hypothesis Testing
Critical value m = 350 Controlling the probability of conducting a type I error • Recall: • H0: m = 350 and H1: m > 350. • H0 is rejected if is sufficiently large • Thus, a type I error is made if when m = 350. • By properly selecting the critical value we can limit the probability of conducting a type I error to an acceptable level.
Steps in Hypothesis Testing 1. Establish hypotheses: state the null and alternative hypotheses. 2. Determine the appropriate statistical test and sampling distribution. 3. Specify the Type I error rate ( 4. State the decision rule. 5. Gather sample data. 6. Calculate the value of the test statistic. 7. State the statistical conclusion. 8. Make a managerial decision.
Testing the Population Mean When the Population Standard Deviation is Known • Example • A new billing system for a department store will be cost- effective only if the mean monthly account is more than $170. • A sample of 400 accounts has a mean of $178. • If accounts are approximately normally distributed with s = $65, can we conclude that the new system will be cost effective?
Testing the Population Mean (s is Known) • Example 11.1 – Solution • The population of interest is the credit accounts at the store. • We want to know whether the mean account for all customers is greater than $170. H1 : m > 170 • The null hypothesis must specify a single value of the parameter m, H0 : m = 170
Approaches to Testing • There are two approaches to test whether the sample mean supports the alternative hypothesis (H1) • The rejection region method is mandatory for manual testing (but can be used when testing is supported by a statistical software) • The p-value method which is mostly used when a statistical software is available.
The Rejection Region Method The rejection region is a range of values such that if the test statistic falls into that range, the null hypothesis is rejected in favor of the alternative hypothesis.
Reject the null hypothesis if The Rejection Region Method for a Right - Tail Test • Example 11.1 – solution continued • Define a critical value for that is just large enough to reject the null hypothesis.
Determining the Critical Value for the Rejection Region • Allow the probability of committing a Type I error be a (also called the significance level). • Find the value of the sample mean that is just large enough so that the actual probability of committing a Type I error does not exceed a. Watch…
a we have: Determining the Critical Value – for a Right – Tail Test Example – solution continued P(commit a Type I error) = P(reject H0 given that H0 is true) = P( given that H0 is true) … is allowed to be a.
Determining the Critical Value – for a Right – Tail Test Example – solution continued a = 0.05
Determining the Critical value for a Right - Tail Test Conclusion Since the sample mean (178) is greater than the critical value of 175.34, there is sufficient evidence to infer that the mean monthly balance is greater than $170 at the 5% significance level.
The standardized test statistic • Instead of using the statistic , we can use the standardized value z. • Then, the rejection region becomes One tail test
The standardized test statistic • Example - continued • We redo this example using the standardized test statistic. Recall: H0: m = 170 H1: m > 170 • Test statistic: • Rejection region: z > z.05 = 1.645.
The standardized test statistic • Example - continued • Conclusion • Since Z = 2.46 > 1.645, reject the null hypothesis in favor of the alternative hypothesis.
The p-value of a test is the probability of observing a test statistic at least as extreme as the one computed, • given that the null hypothesis is true. • Let us demonstrate the concept on Example P-value Method • The p-value provides information about the amount of statistical evidence that supports the alternative hypothesis.
P-value Method The probability of observing a test statistic at least as extreme as 178, given that m = 170 is… The p-value
Example 1 • Calculate the value of the test statistic, set up the rejection region, determine the p-value, interpret the result, and draw the sampling distribution.
如何利用Excel查出標準常態分配機率值 • 標準常態分配(Normal distribution) -> Using插入>fx函數>選取類別(統計)>NORMSDIST 為標準常態分配累積機率值 ->Using插入>fx函數>選取類別(統計)>NORMSINV 求標準常態分配下,給定累積機率反求Z値
Example 2 • A random sample of 18 young adult men (20-30 years old) was sampled. Each person was asked how many minutes of sports they watched on television daily. The responses are listed here. It is known that =12. Test to determine at the 5% significance level whether there is enough statistical evidence to infer that the mean amount of television watched daily by all young adult men is greater than 50 minutes 55 60 65 74 66 37 45 68 64 65 58 55 52 63 59 57 74 65
Solution 3.57
A Two - Tail Test • Example 11.2 • AT&T has been challenged by competitors who argued that their rates resulted in lower bills. • A statistics practitioner determines that the mean and standard deviation of monthly long-distance bills for all AT&T residential customers are $17.09 and $3.87 respectively.
A Two - Tail Test • Example 11.2 - continued • A random sample of 100 customers is selected and customers’ bills recalculated using a leading competitor’s rates (see Xm11-02). • Assuming the standard deviation is the same (3.87), can we infer that there is a difference between AT&T’s bills and the competitor’s bills (on the average)?
A Two - Tail Test • Solution • Is the mean different from 17.09? H0: m = 17.09 • Define the rejection region
a/2 = 0.025 a/2 = 0.025 If H0 is true (m =17.09), can still fall far above or far below 17.09, in which case we erroneously reject H0 in favor of H1 A Two – Tail Test Solution - continued 17.09 We want this erroneous rejection of H0 to be a rare event, say 5% chance.
a/2 = 0.025 a/2 = 0.025 17.55 a/2 = 0.025 a/2 = 0.025 From the sample we have: 0 za/2= 1.96 -za/2= -1.96 Rejection region A Two – Tail Test Solution - continued 17.09
0 za/2= 1.96 -za/2= -1.96 A Two – Tail Test There is insufficient evidence to infer that there is a difference between the bills of AT&T and the competitor. Also, by the p value approach: The p-value = P(Z< -1.19)+P(Z >1.19) = 2(.1173) = .2346 > .05 a/2 = 0.025 a/2 = 0.025 -1.19 1.19
Calculation of the Probability of a Type II Error • To calculate Type II error we need to… • express the rejection region directly, in terms of the parameter hypothesized (not standardized). • specify the alternative value under H1. • Let us revisit Example 11.1
Let us revisit Example 11.1 • The rejection region was with a = .05. a=.05 H0: m = 170 H1: m = 180 m= 170 m=180 Calculation of the Probability of a Type II Error Express the rejection region directly, not in standardized terms • Let the alternative value be m = 180 (rather than just m>170) Specify the alternative value under H1. Do not reject H0
a=.05 H0: m = 170 H1: m = 180 m= 170 m=180 Calculation of the Probability of a Type II Error • A Type II error occurs when a false H0 is not rejected. A false H0… …is not rejected
H0: m = 170 H1: m = 180 m=180 Calculation of the Probability of a Type II Error m= 170
a2 > b2 < Effects on b of changing a • Decreasing the significance level a, increases the value of b, and vice versa. a1 b1 m= 170 m=180
Judging the Test • A hypothesis test is effectively defined by the significance level a and by the sample size n. • If the probability of a Type II error b is judged to be too large, we can reduce it by • increasing a, and/or • increasing the sample size.
By increasing the sample size the standard deviation of the sampling distribution of the mean decreases. Thus, decreases. Judging the Test • Increasing the sample size reduces b
m= 170 m=180 Judging the Test • Increasing the sample size reduces b Note what happens when n increases: a does not change, but b becomes smaller