Download
1 / 37
370 likes | 452 Views
Importance of Genetic Evaluation for Structure in the US Dairy Industry October 10, 2012 Sam Comstock, Ph.D. Linear Descriptive Traits. Stature Strength Body Depth Dairy Form Rump Angle Thurl Position Rump Width. Linear Descriptive Traits. Fore Udder Attachment Rear Udder Height

E N D
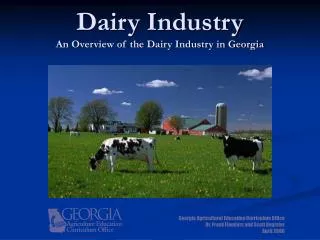
Importance of Genetic Evaluation for Structure in the US Dairy Industry October 10, 2012 Sam Comstock, Ph.D.
Linear Descriptive Traits • Stature • Strength • Body Depth • Dairy Form • Rump Angle • Thurl Position • Rump Width
Linear Descriptive Traits • Fore Udder Attachment • Rear Udder Height • Rear Udder Width • Udder Cleft • Udder Depth • Front Teat Placement • Rear Teat Placement
Linear Descriptive Traits • Teat Length • Udder Tilt • Rear Legs, Side View • Rear Legs, Rear View • Foot Angle • Body Condition
Linear Descriptive Traits • Traits get recorded and reported individually
Linear Descriptive Traits • Educational material provided to breeders • Review regularly • Research traits added as needed
Final Score • An overall score • Based on five major categories (“breakdowns”) • Front End and Body Capacity • Dairy Strength • Rump • Feet and Legs • Udder
Final Score • Major Breakdowns 15% Front End and Body Capacity 20% Dairy Strength 5% Rump 20% Feet and Legs 40% Udder
The Classifiers • Employees of Holstein Association • Full time • Trained (and refreshers) • Continually monitored / evaluated • Rotated through regions • No back-to-back on same farm • Luck of the draw
Types of Classifications • Sire Evaluation for Type (SET) • Young bull daughters compared to herdmates • Whole herd • Or a number of variations for partial herd • Options affect which records are used in genetic evaluation
Handheld Computer • Pre-loaded with • Herd Inventory • Animal ID • “Required” Animals • “Optional” Animals • Record scores for linears and breakdowns • Print results at farm • Transmits to laptop to association
Genetic Evaluation • Phenotypic traits get recorded individually • Most get a genetic prediction Beef EPD == Dairy PTA Linear PTA converted to Standardized Transmitting Abilities (STA)
Genetic Evaluation • Phenotypic traits get recorded individually • Most get a genetic prediction Beef EPD == Dairy PTA Linear PTA converted to Standardized Transmitting Abilities (STA)
Genetic Evaluation • Multi-trait evaluations • Repeat measures • Animal model • Requires estimation of heritabilities and genetic correlations, and development of appropriate analytical models
Genetic Evaluation • 13,000,000 Final Scored cows • 8,000,000 Linear scored cows
Genetic Evaluation • Using the results 18 conformation predictions per animal • Linear prediction useful for corrective matings • Final Score (PTAT) overall prediction
Genetic Evaluation • Using the results 18 conformation predictions per animal • Linear prediction useful for corrective matings • Final Score (PTAT) overall prediction • No breakdown predictions • Composites, instead
Composite Predictions • Feet and Legs • Udder • Dairy Capacity • Body Size
Composite Predictions • Feet and Legs (FA*.48 + RLRV*.37 - RLSV*.15)*.5 + (Feet & Legs Score)*.5 • Udder UD * .35 + FU*.16 + UH*.16 + UW*.12 + UC*.09 + TP*.05 – RP*.07 • Body Size ST*.5 + SR*.25 + BD*.15 + TW*.1 • Dairy Capacity
Composite Predictions • Allow weighted selection on functional traits without becoming overwhelmed in data
Total Performance Index • Combines • Conformation (28%) • Production (43%) • Health & Fertility (29%)
Net Merit $ Index • Classical production function • Uses Composite Conformation Traits • Udder • Feet and Legs • Body Size • Detailed derivation online
Trait Selection • Information overload
Trait Selection • Information overload • Economically relevant • Use to form composite predictions • Incorporate in selection indexes • Use within mating programs