Download
1 / 13
220 likes | 945 Views
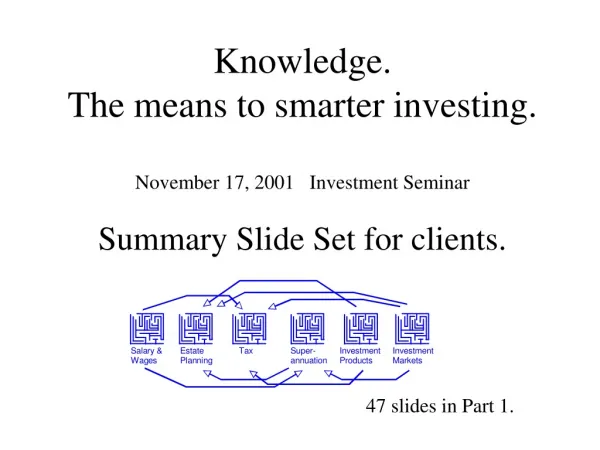
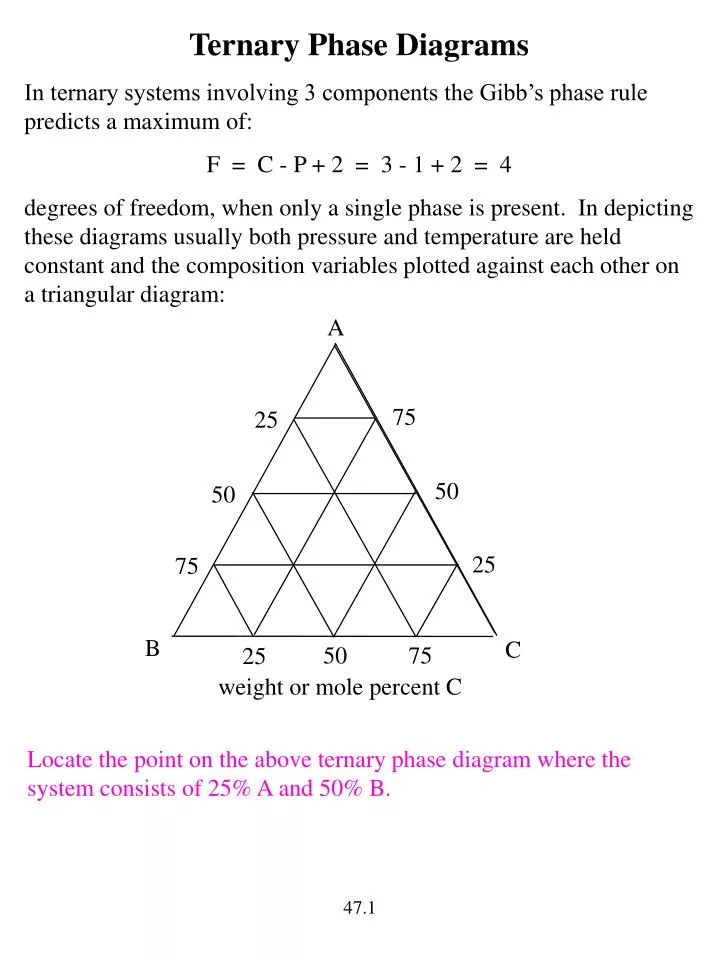
A. 75. 25. 50. 50. 25. 75. B. C. 50. 75. 25. weight or mole percent C. Ternary Phase Diagrams In ternary systems involving 3 components the Gibb’s phase rule predicts a maximum of: F = C - P + 2 = 3 - 1 + 2 = 4

E N D
A 75 25 50 50 25 75 B C 50 75 25 weight or mole percent C Ternary Phase Diagrams In ternary systems involving 3 components the Gibb’s phase rule predicts a maximum of: F = C - P + 2 = 3 - 1 + 2 = 4 degrees of freedom, when only a single phase is present. In depicting these diagrams usually both pressure and temperature are held constant and the composition variables plotted against each other on a triangular diagram: Locate the point on the above ternary phase diagram where the system consists of 25% A and 50% B. 47.1
C A B Locate the system on this diagram that is 31% B and 57% A. 47.2
1500 oC liquid solution isothermal slice at 25 oC 0 oC solid mixture KCl NaCl H2O The ternary phase diagram that we have just described is a constant temperature slice of a 4-dimensional diagram. Consider the NaCl, KCl, H2O ternary phase diagram in which temperature is plotted on a vertical axis at a fixed pressure of 1.00 atm: 1413 oC How would you describe each face of this diagram? How would you describe isothermal slices in this diagram? Point out the location of the lowest temperature at which a mixture of NaCl, KCl, and H2O solid would melt. 47.3
Let’s use the NaCl, KCl, H2O ternary phase diagram shown on the previous page to determine the changes that occur as we follow an evaporative sequencein which water is evaporated from a solution that is initially 10% (w/w) in NaCl and 20% (w/w) in KCl. Locate the initial solution (point i) on the phase diagram. When a particular component is added or removed froma ternary phase diagram, the changes occur along a line drawn from the point describing the state of the system to the location of that component. Draw this line (line i-m) on the phase diagram. 47.4
As water is evaporated from the solution, the solution becomes richer in the dissolved salts, NaCl and KCl, proceeding along line i-d. When the system reaches point reaches the phase boundary at point d, it has just become saturated in KCl and solid KCl will begin to precipitate from solution. The curved line on which point d sits separates a 1-phase liquid solution from a 2-phase region in which pure solid KCl, located at one corner of this region, is in equilibrium with KCl in solution. Continued evaporation of water from the solution causes more pure solid KCl to precipitate, as the system composition moves along the line dh. The composition of the solution in equilibrium with the precipitated KCl is given by intersections of tie lines, which are anchored at the pure solid KCl corner of the phase diagram and which pass through the point describing the overall composition of the system, with the curved line dfb. How many degrees of freedom exist at point d? At any point in the evaporative sequence, e.g. at point e, the mass of water remaining in the system can be calculated as follows (assume that 100 grams of solution was present initially): mH2O = 0.518 mtotal = 0.518 ( mKCl + mNaCl + mH2O ) = 0.518 (20.0 g + 10.0 g + mH2O ) mH2O = 32.0 grams where 0.518 is the weight fraction of water remaining in the system. How much water had evaporated by the time the system reached point e? 47.5
The mass of KCl that has precipitated by the time the system has reached point e can be calculated by applying the lever law to a tie line (line gf) that passes through point e and intersects the pure solid KCl corner: mKCl (s) = mtotal (ef / gf) = (mH2O remaining + mKCl + mNaCl ) (ef / gf) = (32 g + 20 g + 10 g) (10 / 152) = 4 grams What is the composition of the liquid solution that is in equilibrium with this 4 grams of precipitated pure solid KCl? When the system has reached point h in the evaporative sequence, it is saturated in NaCl as well as KCl and pure solid NaCl will begin to precipitate from solution. How many degrees of freedom are present at point h? What are the 3 phases that are in equilibrium at point h and what are their compositions? By the time the system composition has reached point j, substantial pure solid NaCl has precipitated from the solution, as well as more pure solid KCl. The solution composition remains fixed at b. When the system has overall composition j, the masses of liquid of composition b and solid mixture that has precipitated can be calculated from a the tie line constructed through segment bj that intesects the pure solid KCl pure solid NaCl axis at point k. Once the mass of the solid mixture at point k is known, another application of the lever law along the tie line that extends along the pure solid KCl pure solid NaCl axis and passes through point k can be used to calculate the masses of pure solid KCl and NaCl that have precipitated from the solution and comprise the solid mixture at point k. 47.6
When the system is at an overall composition described by point j in the evaporative sequence: What mass of water remains in the system? What mass of water has evaporated? What is the mass of the liquid solution of composition b that remains? How many grams of KCl and NaCl remain dissolved in this liquid? How many grams of solid KCl and solid NaCl have precipitated from the solution Finally when the system reaches point m in the evaporative sequence, all of the water has evaporated and the KCl and NaCl that was initially dissolved in solution remain as a mixture of solids. 47.7
Using good triangular graph paper (available from the book store): a. Construct the ternary phase diagram with weight % axes, placing H2O at the top of the diagram and KCl in the lower left corner, for the system KCl, CaCl2, and H2O from the following data: description of the solid composition of the saturated phase(s) in equilibrum saturated solution in equilibrium with a saturated solutionwith solid phase(s) in weight % CaCl2 KCl KCl 0 33.16 KCl 11.73 21.62 KCl 18.27 16.00 KCl 28.47 9.62 KCl 37.65 6.77 KCl 47.65 8.43 KCl & 2KClCaCl22H2O 50.19 10.32 2KClCaCl22H2O 50.92 9.36 2KClCaCl22H2O 53.85 6.21 2KClCaCl22H2O 56.33 4.51 2KClCaCl22H2O & CaCl22H2O 57.62 3.60 CaCl22H2O 57.77 2.56 CaCl22H2O 58.58 0 b. Label all regions according to the phases that are present. c. describe all the changes that occur as 100.0 grams of a solution that is initially 5.0% KCl by weight and 10.0% CaCl2 by weight is evaporated to dryness. d. at every point where a line of phase equilibria is crossed calculate to the nearest 0.1 gram the mass of H2O remaining in the system, the masses of all phases present, and the masses of KCl and CaCl2 remaining in any solution present. 47.8
Ternary phase diagrams can and probably are used to predict evaporative sequences for companies that produce salts by evaporation of very saline waters. Evaporative ponds for this purpose, for example, are visible from aircraft passing over the Great Salt Lake: 47.9
liquid solution isothermal slice at 30 oC phenol 2 liquid phases acetone H2O Consider the ternary phase diagram involving water, acetone, and phenol. Acetone and water are miscible at all temperatures, as are acetone and phenol. Water and phenol, however, exhibit only limited miscibility below a particular temperature: The top of the domed region in the water/phenol face is refered to by what name? 47.10
As before we will examine an isothermal cross-section (at 30 oC): phenol experimentally determined tie lines b e 1 phase solution a d 2 phase region plait or critical point c f acetone water How would you describe a system that contains 35.0 g of water and 65.0 grams of phenol? 47.12
How does the addition of acetone affect the solubility of phenol in water? How much acetone must be added to reach point d? Calculate the masses of all phases and components present within each phase at point d. The length of tie line segment fd is 113 and the length of segment de is 35 on some ruler scale. How much acetone must be added to the water/phenol mixture described previously to all the water to dissolve in the phenol? 47.13