Download
1 / 17
170 likes | 396 Views
Munich Reinsurance Group in Australasia. Managing extreme weather risks: How do we know what to expect in Asia Pacific? Heinrich Eder. Global mean air temperature - observations. Temperature anomaly ( ◦ C) relative to the 1961-1990 average (14 ◦ C). 2007 is 8th warmest year on record.

E N D
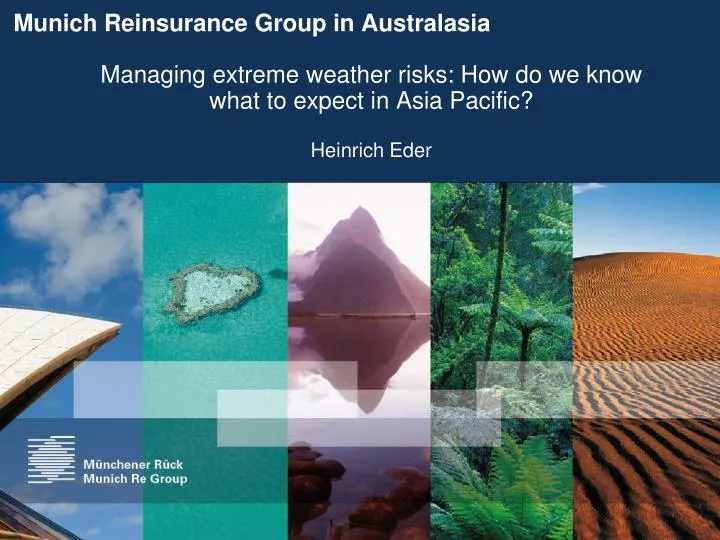
Munich Reinsurance Group in Australasia Managing extreme weather risks: How do we know what to expect in Asia Pacific? Heinrich Eder
Global mean air temperature - observations Temperature anomaly (◦C) relative to the 1961-1990 average (14◦C) 2007 is 8th warmest year on record. The last 13y (1995-2006) represent the warmest on record, exception 1996. 2007 anomaly: +0.40°C, above the 1961-1990 annual mean. Source: CRU, UK (2007)
Australian climate change, observations • Warming of 0.9oC since 1910, mostly since 1950 due to increases in greenhouse gases • 2005 was Australia’s warmest year on record • 2007 was the warmest year on record for SA, NSW and Vic • More heatwaves and fewer frosts • More rain in the west since 1950, but less in south and east • Victoria - drying in autumn Source: BoM/CSIRO
South East Queensland (SEQ) scenarios Gold Coast • SEQ: Brisbane, Gold and Sunshine Coast • > 2.7m residents, 66% of states population • Strongest population growth in Qld (71% within the last 5 years!) • Australia’s highest exposed values concerning TC’s, hence highest accumulated losses. 1966, population 40,000 today > 508,000 Source: Climate Change and Coastal Erosion, Prof. R. Tomlinson, ABS, Qld population update.
Population trends in metropolitan areas • Projections compared to June 2004 population • Fertility rate, mortality, internal and net overseas migration Source: ABS
Climate change projections • Mid range emission scenario for 2030 (relative to 1990) Sydney mean warming of approx 0.9◦C Increase in the frequency of hot days (above 35◦C) Reduction in rainfall over Australia Source: CSIRO/BoM
Risk measurement / underwriting New markets / new products Asset management Integration of sustainability criteria into investment strategies Changed frequencies/ intensities of weather hazards in underwriting/ risk management Pathway to low-carbon, hazard-adaptive economies: new business opportunities Strategic approach to climate change Three areas
Munich Reinsurance Group in Australasia Thank you
Increasing cost of weather related disasters: Main Drivers • Rising population • Better standard of living • Concentration of people and values in large urban areas • Settlement and industrialisation of extremely exposed regions • Susceptibility of modern societies and technologies to natural hazards • Increasing insurance density • Climate Change, particularly future loss development 1950 30% of world‘s population in urban areas2005 50% of world‘s population in urban areas2030 60% of world‘s population in urban areas
Munich Re’s Kyoto Multi Risk Policy Insured: Institutions engaged in projects for generation of emissions credits Compensated: Shortfall of emissions’ reduction compared to plan Advantage: Bundle of traditionally separated insurance lines (physical damage, counterparty risk, country risk, …)
Increasing business opportunities - ENERGY Covers for renewable energies / energy efficient technology • wind power: on-shore / off-shore • Solar thermal / photovoltaic power • coal gasification • biomass • geothermal power • wave power • low energy buildings, e.g. Green Building Council’s Green Star program
Increasing business opportunities - ENERGY Australian energy consumption 2.1% year growth in energy consumption until 2020 => new sources required More hot spells => air conditioners => higher peak energy demand in urban areas • Huge renewable energies’ potentials in Australia • Huge energy efficiency potential • General growth in businesses / economies operating in those areas, resulting in increased economic treaties Covers for low-carbon technologies/energies e.g. carbon capture and storage technologies Insurers: promote these technologies by insurance cover in the construction and performance phase
Demographics: Population growth, Increased standard of living, Increased value at risk, Perception of risk Buildings / Infrastructure: Coastal development, Building construction, design & maintenance, Building Code of Australia, Critical Infrastructure planning Climatology: Intensity and / or frequency, natural climate oscillations Insurance: Non-insurance and Under-insurance, Historical losses, Risk Accumulations and Catastrophe models, Minimises business interruption South East Queensland (SEQ): Tropical Cyclone Estimation of return periods extremely difficult High uncertainties (i.e. large range of losses) from models, exclude storm surge