Download
1 / 69
690 likes | 756 Views
ESRC Obesity e-Lab A new NCeSS node. Prof. Iain Buchan University of Manchester Advisory Board, Manchester, 10 th June 2008. Many thanks to. Dexter Canoy for organising today and the start-up of this project. Today. Project overview and related activities

E N D
ESRC Obesity e-LabA new NCeSS node Prof. Iain Buchan University of Manchester Advisory Board,Manchester, 10th June 2008
Many thanks to... Dexter Canoy for organising today and the start-up of this project
Today • Project overview and related activities • The need for better obesity social science • Some e-Lab use scenarios
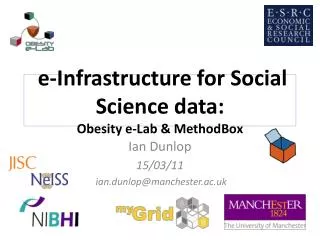
NCeSS Obesity e-Lab Node • Aim: Harness e-Social Science for obesity discovery and policy innovation • £1M/3y from ESRC, starting Sept 08 • Social Epidemiologist: Urara Hiroeh • Engineering team: myExperiment/Carole Goble • Concurrent: Digital Economy Research Cluster
EPSRC e-Health+ Research Cluster • A roadmap for commissioning research in health aspects of the digital economy • Grow the wellbeing industry for public health • New cadre of public health engineers
Re-wiring the brain to the body to support healthy choices Burning Fat Depositing Fat (ketone/other) molecues on skin Active Polymers in wristband +/- other signals & data Frequent Choices
obesityatlas.org.uk A tool for PCTs to monitor child obesity: Paul Jarvis (PhD Student)
Upload a dataset(2 methods) Upload a file Paste data
Biological Risk Factors Combined CVD Risk CVD Patient Groups Population Policies & Behaviours OUTPUTS Diabetes or IGT NON-SUDS SUDS Physical Activity Unstable Angina Chronic Angina CHD Death Combined CVD Risk Obesity (BMI) Diet Cholesterol LDL (& HDL) Early Heart Failure Acute MI From any State Smoking Blood Pressure Recurrent MI Severe Heart Failure Non-CHD Death MI survivors Deprivation Additional CVD Risk Factors Stroke PAD etc MRC IMPACT: New health policy models & methods Outputs: Population-based incidence, prevalence; Deaths prevented; Life-Years; Life expectancy; Costs; Cost-effectiveness ratios
Need for Obesity e-Social Science Discovering the big picture
The ultimate up-stream challenge Millions of years of evolution: Spend energy to eatStore at times of plenty • Recently: energy-density of food • energy required to get food • = the obesogenic environment
Signals from NHS ‘e-labs’ • Large proportion of the populationmeasured consistentlyover a long period • Low migration • Varied environment • Reliable e-records
BMI of 3 yr olds 1988 - 1989 Wirral (0.3M), UK Fifths of BMI SDS BMI fifth Red (light) = fattest Red (dark) Purple Blue (dark) Blue (light) = thinnest
BMI of 3 yr olds 1990 - 1991 Fifths of BMI SDS BMI fifth Red (light) = fattest Red (dark) Purple Blue (dark) Blue (light) = thinnest
BMI of 3 yr olds 1992 - 1993 Fifths of BMI SDS BMI fifth Red (light) = fattest Red (dark) Purple Blue (dark) Blue (light) = thinnest
BMI of 3 yr olds 1994 - 1995 Fifths of BMI SDS BMI fifth Red (light) = fattest Red (dark) Purple Blue (dark) Blue (light) = thinnest
BMI of 3 yr olds 1996 - 1997 Fifths of BMI SDS BMI fifth Red (light) = fattest Red (dark) Purple Blue (dark) Blue (light) = thinnest
BMI of 3 yr olds 1998 - 1999 Fifths of BMI SDS BMI fifth Red (light) = fattest Red (dark) Purple Blue (dark) Blue (light) = thinnest
BMI of 3 yr olds 2000 – 2001 Fifths of BMI SDS BMI fifth Red (light) = fattest Red (dark) Purple Blue (dark) Blue (light) = thinnest
Overweight at 3y ‘caught up’ in affluent areas % overweight or obese by IOTF classification in Wirral from 1988 to 2003, by fifth of IDAC 2004
13-yr-olds’ Body Image vs. BMI Data from S Gowers, Liverpool
Obesity Catastrophe? Economic: Highly-likely Suffering: Likely Deaths: Uncertain scale
Type 2 diabetes incidence in a typical health economy 1600 1400 1200 1000 800 New type 2 diabetics in Salford 600 400 200 0 1997 1999 2001 2003 2005
Exposure (simple): Food intake & physical activity Modifying factors (e.g. sex) Exposure (compound): Sustained +ve energy balance Intermediate outcome: Overweight Intermediate outcome: Central Obesity Outcome (state): Type 2 diabetes Outcome (function): Early death Confounding factors (e.g. transport)
Quilting the Evidence • Patches of evidence on obesity-related diseasesfrom different parts of the life course& old (perhaps out of date) long-running cohort studies. • Overweight children now become overweight adults. • Risk in adults is cumulative. Early precautionary measures justified.
Where, within individuals,is the excess fat going? Does fat distribution matter? (thanks to Dexter Canoy)
Fat compartments Ectopic (liver) Subcutaneous Visceral
BMI and mortality in >1 million adults Calle, NEJM, 1999
Why BMI while mortality? • Possible inconsistencies in BMI predicting mortality: • Confounding • e.g. smoking • Reverse or mixed causality • e.g. loose lean-mass early in diseases • Improved control of mediating factors • e.g. blood pressure, cholesterol • BMI inaccurate measure of adiposity
Waist and hip circumferences Waist to hip ratio (WHR)Tries to estimate visceral to subcutaneous fat proportion
INTERHEART: 12,461 heart attack casesvs. 14,637 controls, from 52 countries WHR BMI Yusuf, Lancet, 2005