Download

1 / 51
510 likes | 658 Views
Centre for Housing Research University of St Andrews. The Effect of Neighbourhood Housing Tenure Mix on Labour Market Outcomes: A Longitudinal Perspective. Dr Maarten van Ham & Dr David Manley. Scottish Social Survey Network, 8 January 2009. Tenure mix policies.

E N D
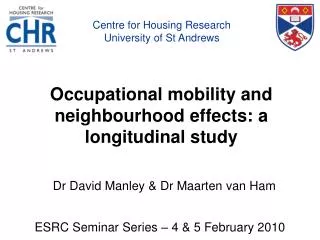
Centre for Housing Research University of St Andrews The Effect of Neighbourhood Housing Tenure Mix on Labour Market Outcomes: A Longitudinal Perspective Dr Maarten van Ham & Dr David Manley Scottish Social Survey Network, 8 January 2009
Tenure mix policies • There is a strong belief in neighbourhood effects: the assumed negative effect of living in deprived neighbourhoods – above and beyond the effect of individual characteristics – on resident’s health, employment and general well-being. • Governments all over Europe have enthusiastically adopted policies to socially mix neighbourhoods. • The main instrument to create socially mixed neighbourhoods is mixing tenures: mixing home owners and social renters.
QUESTION:Is there a benefit of living in a mixed tenure neighbourhood compared to living in a socially rented neighbourhood? We will test this using the Scottish Longitudinal Study
Outline of this talk • Policy background • Existing evidence on neighbourhood effects • Research questions • Why use longitudinal data? • Research design • Models and outcomes • Policy implications
Firm Foundations: the future of housing in Scotland “… worried about the impact that concentrations of social housing have on particular neighbourhoods and the people who live there. The most deprived 15% of neighbourhoods are characterised by high concentrations of social housing and more generally, as chart 13 illustrates, there appears to be a strong correlation between concentrations of social housing and deprivation.”
Firm Foundations: the future of housing in Scotland “The benefits of avoiding concentrations of deprivation and social housing by creating communities with a mixture of tenures and a mixture of households have been recognised for some time.” (Holmes, C., Mixed Communities: Success and Sustainability, Joseph Rowntree Foundation, 2007 as in Firm Foundations)
The evidence? • Research consistently shows that neighbourhoods with high levels of social renting have higher levels of unemployment, crime, and long term limiting illness. • Research also shows that individuals in neighbourhoods with high concentrations of social renting are more likely to be unemployed and suffer from poorer health.
“There is surprisingly little evidence that living in poor neighbourhoods makes people poorer and erodes their life chances, independently of those factors that contribute to their poverty in the first place.” (Paul Cheshire, JRF, 2007)
“do poor people live in poor neighbourhoods because living in affluent ones costs too much? Or does living in a poor neighbourhood make poor people significantly poorer?” (Paul Cheshire, JRF, 2007) Evidence using longitudinal data suggests most neighbourhood effects found are in fact selection effects.
Two problems with many existing studies on neighbourhood effects • Ecological fallacy • Analyses at the level of neighbourhoods do not necessarily say anything useful about processes at the individual level. • Most analyses are cross sectional • Most studies only show correlations and no causation. Existing evidence is most likely reversed causality. • Existing longitudinal studies show no evidence of neighbourhood effects or a benefit of mixed tenure neighbourhoods.
Our contribution to the literature • Individual level analysis (avoids the ecological problem). • Use of longitudinal data from the Scottish Longitudinal Study (SLS), allowing us to follow individuals over a 10-year period (avoiding the cross sectional problem). • Advantages of using the SLS: • Large-scale data set: 5.3% sample of the Scottish population based on 1991 and 2001 individual census records • Low spatial level geo-coding allowing researchers to link neighbourhood characteristics to individual records.
Research Question • The literature suggests that individuals in neighbourhoods with high levels of social renting are less likely to escape unemployment or, if employed, to keep their job. • Research Question: To what extent does the neighbourhood tenure mix influence transitions out of unemployment?
Research design • Model whether the 1991 neighbourhood tenure mix influences the: • probability that those who are unemployed in 1991 have a job in 2001 • probability that those who are employed in 1991 (still) have a job in 2001 . • Controlling for neighbourhood & individual & household characteristics.
Causality • It is important to realise that we use 1991 data to measure 2001 outcome. • For instance: • 1991 Education • 1991 Neighbourhood • 1991 Tenure. • Also include 1991-2001 change variables: • 1991 compared to 2001 Household Status • 1991 compared to 2001 Health.
Definition of Neighbourhood • Need to use administrative neighbourhoods • The use of these is highly contested as neighbourhoods exist at multiple scales and in multiple ways. • We use two scales • Consistent Areas Through Time (CATTs) with 503 people on average • Output Area (OAs) with 119 people on average.
Neighbourhood characteristics • Tenure mix: • Proportion of social renting in an area grouped into 5 categories: 0-20% 20-40% 40-60% 60-80% 80-100%. • Deprivation: • Carstairs index for 1991 data. Includes: • Access to car • Overcrowding • Social Class IV (Dustman) and V (Labourer) • Male unemployment. • Created Quintiles.
Analysis 1 Probability that those who are unemployed in 1991 have a job in 2001
Analysis 2 Probability that those who are employed in 1991 have a job in 2001
Some (initial) conclusions • The initial negative effect of a high level of social renting on employment outcomes disappears when controlled for neighbourhood deprivation, individual level education and tenure. • What remains is a (small) positive effect of living in a mixed tenure neighbourhood on employment outcomes and a negative effect of living in a deprived neighbourhood on employment outcomes. • The neighbourhood effects are relatively small compared to the effect of individual & household characteristics.
Selective mobility into neighbourhoods • The negative effect of living in a deprived neighbourhood on employment outcomes might indicate that: • Living in a deprived neighbourhood has a negative effect on employment outcomes • Unmeasured individual characteristics correlate with both the probability to be unemployed and the probability to live in a deprived neighbourhood. • Using the SLS we can not model the selection mechanism into deprived neighbourhoods before 1991. • But to test robustness of our models we ran separate models for different age, educational, mover status, and tenure groups(owners and social renters).
Selective mobility of owners into deprived neighbourhoods • The tenure split models only show neighbourhood effects for owners and not for renters. • Does this mean that neighbourhood effects only exist for owners? • NO… it is more likely that those owners most at risk of unemployment in 1991 selected themselves into deprived neighbourhoods. • Such a selection mechanism did not operate for social renters as most were (randomly) allocated a dwelling (and neighbourhood) in 1991
Implications for policy 1 • There is no evidence of an independent effect of neighbourhood characteristics on labour market outcomes. • Poor people live in poor neighbourhoods because living in affluent ones costs too much… but living in a poor neighbourhood does NOT make poor people significantly poorer. • This does not take away the problem of concentrated poverty in deprived neighbourhoods.
Implications for policy 2 “Trying to create mixed neighbourhoods costs substantial resources that could be used directly to relieve poverty.” “There is a danger that trying to create mixed neighbourhoods diverts efforts away from tackling the underlying causes of poverty and social exclusion, lulling us into a comforting but false belief that we are doing something positive.” (Paul Cheshire, JRF, 2007)
Future research… • Further investigate transitions instead of states. • Need to model selection mechanisms into neighbourhoods. • Need for longitudinal data to fill the 10-year gap between the 1991 and 2001 census.