Download
1 / 13
130 likes | 233 Views
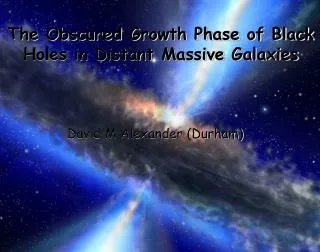
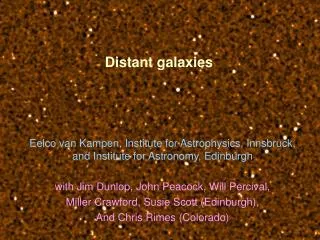
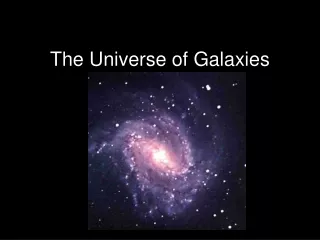
Testing the use of Adaptive Optics to reveal the age of distant galaxies. Emily De La Garza University of Houston-Downtown University of California, Santa Cruz Center for Adaptive Optics. Galaxy Background. Hubble Space Telescope. The HST takes high resolution UV and optical images.

E N D
Testing the use of Adaptive Optics to reveal the age of distant galaxies Emily De La Garza University of Houston-Downtown University of California, Santa Cruz Center for Adaptive Optics
Hubble Space Telescope • The HST takes high resolution UV and optical images. • The images give data which can fit different age models for the galaxy. • A galaxy could look 10 Giga years old and really be 5 Million years old with a high dust content. Dim Bright BlueRed
The missing wavelength • The HST resolution in the near infrared is poor. • Near infrared penetrates through the dust. • We are able to see individual components of the galaxy. • Adaptive Optics on large ground-based telescopes allows high resolution in the infrared.
Testing Near UV I Band (Optical) K Band (IR) • We viewed a simulated galaxy and made spectra for each of the filters used. • We measured four different areas for their flux and wave length.
Bruzaul and Charlot’s Program • This program allows the user to choose the dust content, bursts of star life, and how old the galaxy is. • It then simulates the data from the specifications • We used these graphs to fit the simulated galaxy against.
Normalizing • In order to plot everything together, each component was normalized. • To find out the age of the simulated galaxy, we over plotted onto the Bruzaul and Charlot graphs to find a fit. Log Flux Dim Bright Wavelength in Micro-Meters BlueRed
Near and Far Ultraviolet Log Flux Dim Bright • During experimenting with Tau models for star life, the near and far UV proved essential. Wavelength in Micro-Meters BlueRed
Log Flux Dim Bright Wavelength in Micro-Meters BlueRed
Adding Adaptive Optics No Atmosphere With Atmosphere With Atmosphere & AO • Placed galaxy into a galaxy field to add atmosphere and correct with AO.
Correction For The Bulge Log Flux Dim Bright Wavelength in Micro-Meters BlueRed
Research To Come • Adding multiple bursts to models for a better fit • Experiment more with AO correction.
Acknowledgments • Dr. David Koo – Principal Investigator • Jason Melbourne – Research Supervisor • Malika Bell – Education Coordinator (CfAO) • Hilary O’Bryan – Program Assistant (CfAO) • Center for Adaptive Optics • HACU • Patrik Jonsson • Anne Metevier • Layra Reza • Monica Pinon • Oscar Azucena • Carlos Andres Cabrera This project is supported by the National Science Foundation Science and Technology Center for Adaptive Optics, managed by the University of California at Santa Cruz under cooperative agreement No. AST - 9876783.