Download
1 / 34
340 likes | 498 Views
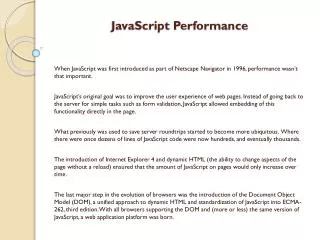
JavaScript Performance Tuning Secrets. Peter Flynn | Adobe. Slides & links: github.com/ peterflynn /jsconf-2013. Me. Brackets. Why is This Hard?. ?. ?. ?. var start = performance. now () ; // ... Do some stuff ... var end = performance. now () ;

E N D
JavaScript Performance Tuning Secrets Peter Flynn | Adobe Slides & links: github.com/peterflynn/jsconf-2013
Me Brackets
Why is This Hard? ? ? ? • varstart = performance.now(); // ... Do some stuff ... • varend = performance.now(); • console.log((end – start) + "ms"); • // CSS style calculation • // Layout • // Repaint • // Wait for vsync - now user sees update • // --> Date.now() == ??? ?
Rendering VM Guts Dev tools Timeline tricks Memory profiling tricks Craziness chrome://tracing CPU profiling tricks High-speed cameras V8 logging
Custom Timeline Markers console.timeStamp("Event foo");
Custom Timeline Markers console.time("doTick()"); console.timeEnd("doTick()");
Can Haz Automation? Dev tools (including Timeline) are built on an API • … a JSON API that’s exposed over a socket connection • Remote Debugging API Telemetry testing framework • Built atop the debugging API • Python scripts &testcase templates (PageMeasurements) • Includes UI automation abilities – click, scroll, etc.(Aided by a scrolling API it enables in Chrome)
Can Haz Automation? myPage.json Grab Chrome src (need not compile) tools/perf/run_multipage_benchmarks –browser=system smoothness_benchmarkmyPage.json { "url": "http://localhost:8080/myPage", "smoothness": [ {action: scroll, selector: ".main-content"} ] }
Can Haz Automation? Awesome examples: • Run tests: https://github.com/topcoat/topcoat/tree/master/test/perf/telemetry • Track results, visualize with D3: https://github.com/topcoat/topcoat-server
Ground Truth Casio Exilim Pro EX-F1
Rendering VM Guts Dev tools Timeline tricks Memory profiling tricks Craziness chrome://tracing CPU profiling tricks High-speed cameras V8 logging
Instrumented CPU Profiling Profiler • Nesting / semi-overlapping ok chrome://tracing • console.profile("createList"); • // ... • console.profileEnd("createList"); console.time("foo()"); // ... console.timeEnd("foo()");
V8 Logging Analysis • svncheckout http://v8.googlecode.com/svn/trunk/ v8 • Mac: make dependenciesWin: svn co http://gyp.googlecode.com/svn/trunk build/gyp • GCC: make nativeXcode:build/gyp_v8 -Dtarget_arch=ia32xcodebuild-project build/all.xcodeproj -configuration ReleaseVisual Studio:svnco http://src.chromium.org/svn/trunk/deps/third_party/cygwin@66844third_party\cygwinpython build\gyp_v8"C:\Program Files (x86)\Microsoft Visual Studio 10.0\Common7\IDE\devenv.com" /build Release build\All.sln • Set D8_PATH to build output folder • Install gnuplot & add to PATH
V8 Logging: plot-timer-events • Close all Chrome instances • chrome--no-sandbox--js-flags="--prof --noprof-lazy --log-timer-events""file://foo.html" • Find v8.log next to Chrome lib (version-numbered folder) • tools/plot-timer-events v8.log • Find timer-events.png next to v8.log Note: plot-timer-events script may not work on Windows – see .plt hack in a sec.
V8 Logging: plot-timer-events tools/plot-timer-events v8.log --range=<start>,<end>
V8 Logging: plot-timer-events echo -e "plot-range,$plot_range\ndistortion,$distortion" | cat - v8.log | $D8_PATH/d8 tools/csvparser.js tools/splaytree.js tools/codemap.js tools/profile.js tools/profile_view.js tools/logreader.js tools/tickprocessor.js tools/plot-timer-events.js | less 2>/dev/null > timer-events.plt set terminal pngcairo size 1600,600 enhanced font 'Helvetica,10' set yrange [0:23.5] set xlabel "execution time in ms" set xrange [1:13646.018000000004] set style fill pattern 2 bo 1 set style rectfs solid 1 noborder set style line 1 lt 1 lw 1 lcrgb "#000000" … set object 1 rect from 50.00350000000002, 11.17 to 50.005000000000024, 11.83 fc rgb "#000000" set object 2 rect from 51.00200000000001, 11.17 to 51.00650000000003, 11.83 fc rgb "#000000" set object 3 rect from 80.00750000000004, 11.17 to 81.01000000000005, 11.83 fc rgb "#000000" set object 4 rect from 82, 11.17 to 83.01000000000005, 11.83 fc rgb "#000000" set object 5 rect from 84, 11.17 to 84.01000000000005, 11.83 fc rgb "#000000" set object 6 rect from 85.00150000000001, 11.17 to 85.01600000000008, 11.83 fc rgb "#000000" …
V8 Logging: tick processor tools/mac-tick-processor.bat v8.log > tick-report.txt (or \win-…) [Bottom up (heavy) profile]: Note: percentage shows a share of a particular caller in the total amount of its parent calls. Callers occupying less than 2.0% are not shown. ticks parent name 3155 23.2% C:\Users\pflynn\AppData\Local\Google\Chrome SxS\Application\29.0.1521.0\chrome.dll 2035 64.5% LazyCompile: jQuery.extend.style file:///.../jquery-1.7.js:6565 2033 99.9% LazyCompile: *<anonymous> file:///.../jquery-1.7.js:6520 1997 98.2% LazyCompile: *jQuery.extend.access file:///.../jquery-1.7.js:829 1997 100.0% LazyCompile: *jQuery.extend.access file:///.../jquery-1.7.js:829 1997 100.0% LazyCompile: *jQuery.fn.css file:///.../jquery-1.7.js:6514
V8 Logging: opt/deopt tracing chrome --no-sandbox --js-flags="--trace-opt-verbose --trace-deopt""file://foo.html" > opt-log.txt [disabled optimization for 0x2474ca11 <JS Function foo.bar (SharedFunctionInfo 0x47820a4d)>, reason: eval] Note: may not work on Windows.
Or… Ignore all this!
1. Is Network Performance More Important? varloadTiming= performance.timing; varresources = performance.webkitGetEntriesByType("resource");
Performance APIs Resource Timing • Load timing of each resource on page Async Scroll • API to test scrolling performance Display Performance • API for frame rate, etc. Web Performance Working Group
2. Good Enough Already? function createMenuItems() { array.forEach(function (item) { whatever(item); }); } OMGZ! 1258 ops/sec x 10,000 iterations = 12,580,000 iterations/sec vs. 80,810,000 iterations/sec
3. Better Uses of Time? Engineering time is a finite resource More features Fix bugs Improve documentation More testing Ship sooner Support more platforms Improve usability Architectural/code cleanup