Download
1 / 8
80 likes | 195 Views
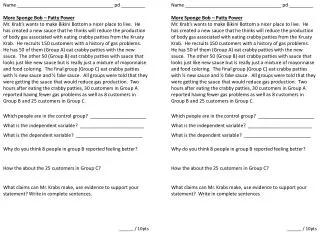
Finish sponge bob variable sheet. We will grade in 10min. Which ever group has the most problems done correctly will win a prize!!. 1) Data Table. Used when collecting data Usually the Independent Variable is in the First Column and the Dependent in the 2 nd column, always has a title

E N D
Finish sponge bob variable sheet. We will grade in 10min. • Which ever group has the most problems done correctly will win a prize!!
1) Data Table • Used when collecting data • Usually the Independent Variable is in the First Column and the Dependent in the 2nd column, always has a title • Example:
2) Bar Graph • Used when you are comparing information. • Ex.
Bar Graph Activity • Problem: What school are most of the students from (feeder school)? • Hypothesis: If we have Anderson, Cheatham, Marion, Olson, Reed, or other then _________ will have the most students. • Procedure: survey • Collect Data:
3) Line Graph • Used when changes occur over time – continual data • Ex.
Line Graph Activity • Problem: How does exercise affect my heart rate? • Hypothesis: If I did 25 jumping jacks then my heart rate will _______________ . • Procedures: • 25 jumping jacks • Find heart rate for each minute up to 3 min.
4) Pie Graph • Used when showing percentage or parts of a whole • Ex. Pizza 48%
Graphing Tips • All graphs should have: • T – title • A – axis • I – intervals • L – labels/legends • S – scale (appropriate size)