Download

1 / 23
230 likes | 350 Views
Combined Utility System Cost of Service Rate Study Presentation April 6, 2010. Combined Utility System (CUS). The CUS is an enterprise fund All funds used in the CUS are generated from water & sewer rates and fees Does not receive any general fund money

E N D
Combined Utility System Cost of Service Rate StudyPresentation April 6, 2010
Combined Utility System (CUS) • The CUS is an enterprise fund • All funds used in the CUS are generated from water & sewer rates and fees • Does not receive any general fund money • Closed system – Under CUS master bond ordinance, cannot fund anything but water and sewer services • One exception – may fund a limited amount of drainage out of fund balance, per Ord. 2004-299 • Cannot send funds to the general fund
Recent History of CUS Rising prices for FY04 through FY10 • TCEQ Unfunded Mandate -Annual Fees 228% • Chemicals 167% • Electricity 136% • Sludge Disposal 99% • Infrastructure Maintenance (O&M) 76% • Insurance 60% • Health Insurance/Pension 52% • Overall O&M 32% • Annual Debt Service – First/Junior Liens 53% ($233M in FY04, $356M in FY10)
Recent History of CUS Residential Water Use per account Fiscal Year 2004 - 2010 • Residential consumption in gallons per month has declined as more low flow appliances and fixtures are installed. • As townhouses/condominiums replace single family homes, also see lower consumption per account. • From FY04 to FY09 the range has been from a high of 6,736 in FY06 (drought year) to a low of 5,971 in FY07. The average from FY04 to FY09 is 6,276. • In the last 3 years average is 6,006 gallons/month. This trend continues into FY10 given the colder fall, winter and spring. • Even though lower usage recently, must have capacity for drought demand
CUS Historical Charts Total Revenues Average Residential Customer Gallons/Month Billed O&M Expenditures * FY10 is current projection prj = projection
CUS Financial Position FY07 through FY11 * February 2010 PWE MFOR Submission
Recent Steps Taken to Decrease CUS O&M • PWE has adopted less expensive ways to treat water and buy chemicals • Cost savings in chemicals alone for FY10 will exceed $4M • Implementing McKinsey & Company recommendations for an estimated $7 million in savings in FY11 • Continuing to review/re-negotiate contracts for savings • Bio-solids contract change – savings of $7.0 million over next 5 years • Sludge removal contract – savings of $800k over 5 years • Began energy conservation study for major wastewater facilities • Significant capital costs that will be paid for out of energy savings • Long term benefits only
FY10 Rate Study Objectives of Rate Study • Understand the System’s “cost of service” rates for each customer class for water and wastewater • Propose rates that ensure revenues fully cover the CUS’s costs and that meet all bond covenants – debt coverage and sound business practices • Propose rates that provide for the long term health and sustainability of the system • Consider new rate structure that moves rates in the direction of covering actual cost of service for each rate class over time • Restructure program by replacing “lifeline” rate (over time) with service charge waiver or discount for qualified single family customers • Structure single family rates to encourage conservation • Ensure that contract/non-City of Houston customers’ rates are set at the “cost of service” rate – not subsidized by Houston citizens
Options for Rate Study The Rate Study created three financial scenarios *HSR plus other selected investments ** Provide for the long term health and sustainability of the system – best practices History of CUS Water and Wastewater CIP
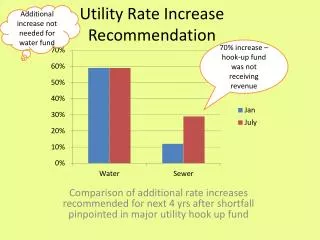
CUS Annual Debt Coverage Ratio History Annual Debt Coverage Ratio – Threshold 1.2 Net revenues to first lien debt service Prior to FY10, NO use of fund balance was required for this bond covenant. FY10 requires an estimated $40M use of fund balance to meet this covenant.
Consequences of Doing Nothing • The CUS must at least implement the Minimum Health, Safety & Regulatory CIP to meet regulatory requirements.
Consequences of Doing Nothing • The system will continue to lose money • Likely downgrades from Rating Agencies • Moody’s assigned a NEGATIVE outlook to the CUS on March 2nd, 2010. If the CUS issues new debt without a significant rate adjustment, the System risks a ratings downgrade. • Downgrades will result in higher costs • Higher interest cost over the bonds life per $100M Par. Estimates: A1 to A2 $2.3M, A1 to A3 $3.45M & A1 to BAA1 $5.75M • Letters of Credit fees increase for every ratings downgrade, per notch: A1 to A2 $3.2M higher fees, at A2 to A3 add $0.7M plus A3 to BAA1 add $1.1M • If insured, higher insurance fees on new issues will cost more • Downgrades may impact future LOC availability
Proposed 2011 Residential Monthly Water & Wastewater Bill This rate class three year average gallons per month is 6,000
Water & Wastewater Rate Comparison Single Family 3,000 Gallons 5/8 & 3/4 Inch Meters
Water & Wastewater Rate Comparison Single Family 6,000 Gallons 5/8 & 3/4 Inch Meters
Water & Wastewater Rate Comparison Single Family 10,000 Gallons 5/8 & 3/4 Inch Meters
Water & Wastewater Rate Comparison Multi-Family 10,000 Gallons
Water & Wastewater Rate Comparison Commercial 10,000 Gallons
Recommendations • Set rates at Best Practices CIP rates to ensure long term health and sustainability of the system • Set all non-city rates at cost of service • Implement Water & Wastewater rate adjustment June 1st • Change annual automatic rate increase to be based on PPI, not to exceed annual CPI plus population index,in compliance with Proposition 1
Comparison of Regional CPI vs. PPI Houston Regional CPI & PPI In Percentages Annual Percentage Abbreviations: “PPI” - Producer Price Index all commodities