Download
1 / 27
270 likes | 374 Views
Learn about willingness to pay, consumer surplus, demand models, the law of demand, market analysis for goods like tacos and soda, definitions of normal and inferior goods, substitutes, complements, and factors affecting supply.

E N D
Willingness to Pay - is the maximum amount a person would be willing to pay, sacrifice or exchange for a good • Consumer Surplus – the value to a consumer of consumption of a good, minus the price paid Demand
Diminishing marginal value – the value of last unit consumed declines as the number consumed rises Demand
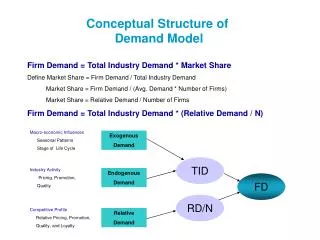
MODEL OF DEMAND • The model of demand is an attempt to explain the amount demanded of any good or service. DEMAND DEFINED The amount of a good or service a consumer wants to buy, and is able to buy per unit time. Demand
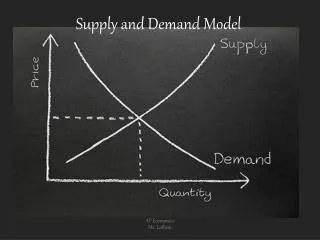
THE DEMAND CURVE • The demand curve for any good shows the quantity demanded at each price, holding constant all other determinants of demand. • The DEPENDENT variable is the quantity demanded. • The INDEPENDENT variable is the good’s own price. Demand
THE LAW OF DEMAND • The Law of Demand says that a decrease in a good’s own price will result in an increase in the amount demanded, holding constant all the other determinants of demand. • The Law of Demand says that demand curves are negatively sloped. Demand
A DEMAND CURVE • A demand curve must look like this, i.e., be negatively sloped. own price demand quantity demanded Market for tacos Demand
p0 Q0 The demand curve means: You pick a price, such a p0, and the demand curve shows how much is demanded. own price demand quantity demanded Market for tacos Demand
What if the price of tacos were less than p0?How do you show the effect on demand? Go to hidden slide Demand
Suppose people want to buy more of a good when incomes rise, holding constant all other factors affecting demand, including the good’s own price. own price How does this affect the demand curve? $1/can demand @ I = $1000 quantity of soda Market for soda Demand
Normal and inferior goods defined • Normal good: When an increase in income causes an increase in demand. • Inferior good: When an increase in income causes a decrease in demand. • Necessities of Life: Food, Water, ClothingNormal Goods: Television, Radio/CD Player, Mobile PhoneInferior Goods: Bargain food (prices cut down because they've passed their "sell-by" date, a second hand/used television, clothing from a charity store. Demand
Substitutes defined • Substitutes: Two goods are substitutes if an increase in the price of one of them causes an increase in the demand for the other. • Thus, an increase in the price of pizza would increase the demand for spaghetti if the goods were substitutes. Demand
Complements defined • Complements: Two goods are complements if an increase in the price of one of them causes a decrease in the demand for the other. • Thus, an increase in the price of pizza would decrease the demand for soda if the goods were complements. Demand
DEMAND SUMMARY • Demand is a function of own-price, income, prices of other goods, and tastes. • The demand curve shows demand as a function of a good's own price, all else constant. • Changes in own-price show up as movements along a demand curve. • Changes in income, prices of substitutes and complements, and tastes show up as shifts in the demand curve. Demand
MODEL OF SUPPLY The model of supply is an attempt to explain the amount supplied of any good or service. SUPPLY DEFINED The amount of a good or service a firm wants to sell, and is able to sell per unit time. Supply
YOU COULD WRITE THE MODEL THIS WAY: The supply function for tacos QS(tacos) = S(Ptacos, Ptaco shells, Plettuce, Plabor, Ptomatoes, . . . ,technology, taxes & subsidies) Supply
THE SUPPLY CURVE • The supply curve for any good shows the quantity supplied at each price, holding constant all other determinants of supply. • The DEPENDENT variable is the quantity supplied. • The INDEPENDENT variable is the good’s own price. Supply
THE LAW OF SUPPLY The Law of Supply says that an increase in a good’s own price will result in an increase in the amount supplied, holding constant all the other determinants of supply. The Law of Supply says that supply curves are positively sloped. Supply
A SUPPLY CURVE A supply curve must look like this, i.e., be positively sloped. supply own price quantity supplied TACO MARKET Supply
p0 Q0 The supply curve means: You pick a price, such a p0, and the supply curve shows how much is supplied. own price supply quantity supplied TACO MARKET Supply
If the price of tacos rises, how is the supply curve affected? own price supply p0 quantity supplied Q0 TACO MARKET Supply
Other factors affecting supply The question here is how to show the effects of changes in input prices, technology, and taxes. The answer, of course, is that changes in input prices, technology, or taxes cause the supply curve to shift. Supply
Changes in input prices • Consider the supply of pizza, and suppose the price of flour, a crucial input to pizza, falls. Pizza firms now find that pizza production is more profitable than it was before, and they respond to this be increasing the supply of pizza. Supply
The price of hops falls from $300 per ton to $100 per ton. own price supply @ hops price of $300/ton How will this affect the supply curve for beer? quantity BEER MARKET Supply Go to hidden slide
Change in technology • An improvement in technology makes it possible to produce a level of output with fewer inputs than before. • Because this lowers the cost of production, profits rise, and firms will try to supply more. Supply
Suppose pizza technology improves. own price supply @ old technology How does this affect the supply curve for pizza? quantity PIZZA MARKET Supply Go to hidden slide
How would you suspect an excise tax affects the supply of a good? price S (no tax) Q Supply Go to hidden slide
Supply summary Supply is a function of own price, input prices, and technology. The supply curve shows supply as a function of own price, all else constant. Changes in a good’s own price show up as movements along a supply curve. Changes in input prices, technology, or taxes show up as shifts in the supply curve. Supply