Download
1 / 35
350 likes | 467 Views
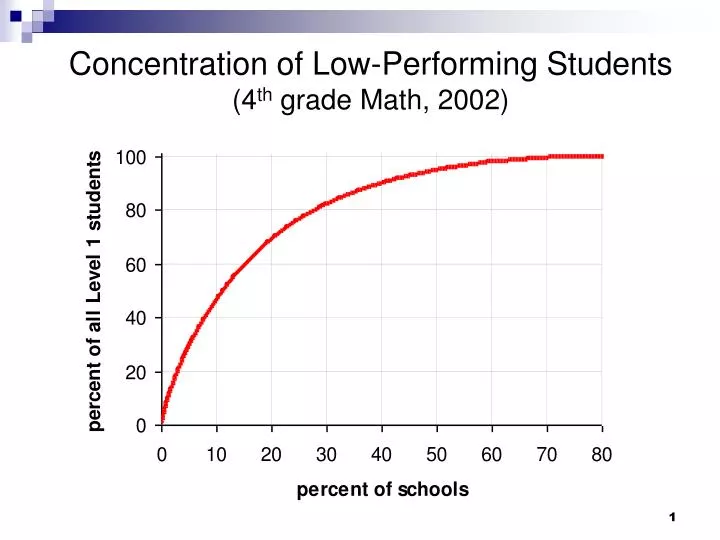
Concentration of Low-Performing Students (4 th grade Math, 2002). Teacher Sorting in NYS Elementary Schools (Math 2002). 85 Percent of New York State Teachers Take First Job within 40 Miles of Home. Policy Challenge. How do public schools:

E N D
Concentration of Low-Performing Students (4th grade Math, 2002)
85 Percent of New York State Teachers Take First Job within 40 Miles of Home
Policy Challenge How do public schools: • Attract potentially excellent teachers to teaching, especially in traditionally difficult-to-staff schools? • Provide the skills and experiences that help potentially excellent teachers develop into excellent teachers in those schools? • Retain strong teachers, especially in traditionally difficult-to-staff schools?
Data Collection • Program analysis • State documents, program documents, accreditation reports, interviews, surveys, course syllabi; 18 institutions that prepare most traditional route teachers for NYC schools • Alternate route programs that prepare about 25 percent of NYC teachers • Surveys • Graduating program participants (2004), new NYC teachers (2005), second year and former teachers (2006) • Administrative data • All NYC teachers 1990-2006; rich measures of teacher qualifications, including certification exams and areas, teacher retention. • Student achievement 2000-2006; value-added scores in math and ELA, grades 4-8 linked to teachers. • Data on schools and students
Examining Teacher Preparation Paths What is the relative effectiveness of alternatively certified teachers compared to those prepared in traditional college preparation programs? • Selection: alternative certification teachers appear to have stronger academic credentials • Preparation: traditional preparation teachers have an undergraduate teacher education program; alternative certification teachers a 7 week summer program
Data and NYC Context • Achievement gain data from NYC for 1999-2000 through 2003-2004 – student gains in grades 4-8 linked to teacher. • DEFINING PATHWAY - The route teachers follow into their first teaching job. • College Recommended • Individual Evaluation (transcript review) • NYC Teaching Fellows • Teach for America • Temporary License (uncertified) • Other (i.e. reciprocity, other Transitional B programs, provisional) • Caveat: All teachers in New York must ultimately complete the same set of requirements to receive certification.A lot of overlap and a lot of variation within pathways. For example, this past year about 1/4th of traditional did student teaching as teacher of record.
Entering NYC Teachers by Pathway: Teaching Fellows Replace Temp License
Average Certification Exam Scores First Taking: (2004; Passing= 220,SD=~30)
Characteristics of Students by Pathway of First-Year Teachers
Methodology School, Grade, and Year Fixed Effects Aisgjt=b0+b1Aisgj(t-1)+b2Kit+g2Cj+Ejg1+g1Pj+πg+πt+πs+εisgjt • Specification Checks • Interactions with Experience • Gain as the outcome • Gains with student fixed effect • Only those with three or fewer years of experience • School by year by grade fixed effects • two stages • Analysis of the importance of school and class by omitting school fixed effects and classroom controls • Alternative Definitions of Pathway • Subgroups of Students • Incorporating Turnover
Results of Student, Peer and Experience Variables,Base Math Model with grade, year & school fixed effects (n=960,970)
Total Pathway value-added findings for math with school-fixed effects (relative to College Recommended) *= significant at 10% **= significant at 5%***= significant at 1%
Effects on Student Achievement by Pathway by Experience, Math, Grades 4-5(Coll. Rec. 1 yr =0;) *Caution – small sample size for third-year TFA makes interpretation of results tricky
Effects on Student Achievement by Pathway by Experience, Math, Grades 6-8(Coll. Rec. 1 yr =0;) *Caution – small sample size for third-year TFA makes interpretation of results tricky
How Important Are These Effects? • Statistical significance • Comparison to other effects • 1st-year Teaching Fellows vs. CR teachers—0.04 difference in student gains in grade 4-5 math • Similar in magnitude to 80% of the gain attributed to 1st year of teaching experience (0.048) • 3rd year TF vs. CR teachers—0.056 difference in student gains in 6-8th grade math (0.091 minus 0.035) • greater in magnitude than 1st year of experience gain
How Important Are These Effects (con’t)? • Conversion to scale score For example, 7th grade math exam in 2002 had mean score=670, and std dev = 48. The 0.056 advantage of 3rd year Teaching Fellow versus 3rd year CR from prior example • equals about 2.7 scale points (48 x .056) • a 2.7 scale point increase moves past 2.5% of students at mean
Given the effectiveness of teachers improves with their first few years of experience, any such differences in attrition could affect differences in value-added across pathways. Is there differential attrition by pathway?
Grades 4-8 Teacher Attrition Following the 1st Four Years of Teaching, 1999-2003 Cohorts Adjusted for grade School and Year
Simulated Student Achievement Gains by Pathway Accounting for Differential Attrition, Math 4-5
Simulated Student Achievement Gains by Pathway Accounting for Differential Attrition, Math 6-8
Summary • Reduced entry requirements are attracting a substantial number of teachers with strong qualifications. • Currently these teachers appear to be more effective in math than ELA and more effective in middle school grades than in upper elementary. • Alternate route teachers are not, on the whole, doing better than college recommended teachers, and are doing worse in some cases. However, few of the differences across pathways are statistically significant. • Need to look at the effects of characteristics of pathway on selection and preparation to figure out how to maximize effectiveness…
Not satisfying yet… • Methodological question about the social significance of effects • Estimating the size of teacher effects (separating from schools) • Measurement error • Variation in effects and experiences within pathways - trying to get at this with larger study
Childhood Program Math Value-Added(Grades 4-8, programs with at least 50 observations, with school fixed effects and controls for teacher attributes)
Childhood Program ELA Value-Added(Grades 4-8, programs with at least 50 observations, with school fixed effects and controls for teacher attributes)
Relationship of Program Features to Student Math Achievement • Constructed variables related to preparation, based on 1st year teacher survey responses • Variables/factors linked to 5 aspects of preparation • Program structure • Preparation for teaching math • Preparation in learning/development, including preparation in classroom management • Preparation to teach linguistically and culturally diverse students • Field experiences
Content-Specific Preparation • General opportunities to learn about the teaching of math (Genmath): includes 12 items related to opportunities to: • Learn typical difficulties students have with place value • Study, critique, or adapt math curriculum materials • Study or analyze student math work
Field Experiences • Field-job congruence: • My experiences in schools were similar to my current job in terms of grade level • My experiences in schools were similar to my current job in terms of subject area • Field-program coherence: • My program lacked a sense of coherence among courses and between courses and field experiences • What I learned in methods courses reflected what I observed in my field experiences or in my own classroom
Learning About Learning • Learning factor: • Includes 8 items related to learning about child development and learners, including special education, classroom management. • Relative emphasis on: • Develop strategies for handling student misbehavior • Develop specific strategies for teaching English language learners (those with limited English proficiency)
Opportunities Grounded in Practice • Relative emphasis on opportunities to • Listen to an individual child read aloud for the purpose of assessing his/her reading achievement • Plan a guided reading lesson • Study or analyze student math work • Relative opportunities to: • Review New York City reading curriculum • Review New York City mathematics curriculum
Value-Added of Preparation Program Features(Math, 2005 cohort) • Controlling for • student prior scores • a rich set of student characteristics • a rich set of aggregate student characteristics at the classroom level • teacher attributes • pathway
Effect of Program Attributes on 4th – 8th math student achievement
With important caveats… • Analysis depends on significant variation in experiences. Doesn’t mean other factors aren’t important; Opportunities to learn to teach math, for example, may be very important but not enough variation in this factor to be significant. • Differences in quality of experience, rather than quantity, may matter most. Yet quality is hardest to measure in large scale studies. • We are early in the process of this analysis.
Challenge to teacher educators The importance of creating opportunities for students to engage in practice-based activities (e.g., analyzing student work in math, conducting individual reading assessments, studying NYC curriculum).