Download
1 / 5
60 likes | 212 Views
Monte Carlo Simulation (MCS). This is a kind of “experimental statistics”. In other branches of science, for example physics, the relationship between theory and experiment can be depicted in this way:. Equipment,. Experimental. Theoretical. Observation. Physics.

E N D
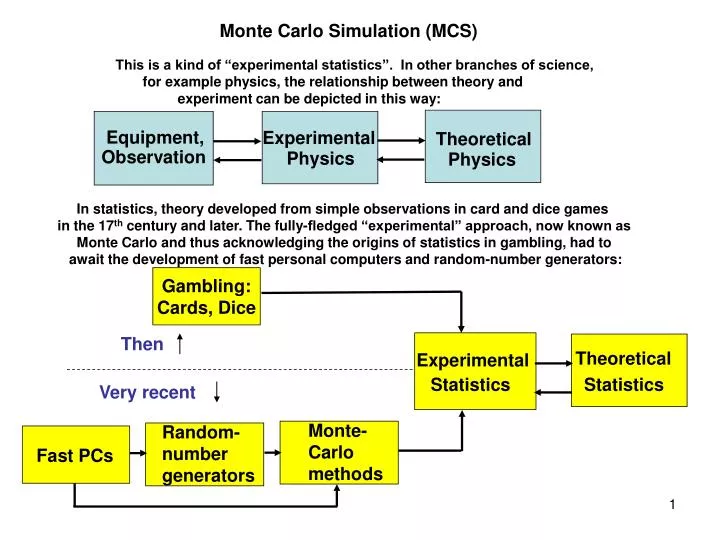
Monte Carlo Simulation (MCS) This is a kind of “experimental statistics”. In other branches of science, for example physics, the relationship between theory and experiment can be depicted in this way: Equipment, Experimental Theoretical Observation Physics Physics In statistics, theory developed from simple observations in card and dice games in the 17th century and later. The fully-fledged “experimental” approach, now known as Monte Carlo and thus acknowledging the origins of statistics in gambling, had to await the development of fast personal computers and random-number generators: Gambling: Cards, Dice Then Theoretical Experimental Statistics Statistics Very recent Monte- Carlo methods Random- number generators Fast PCs
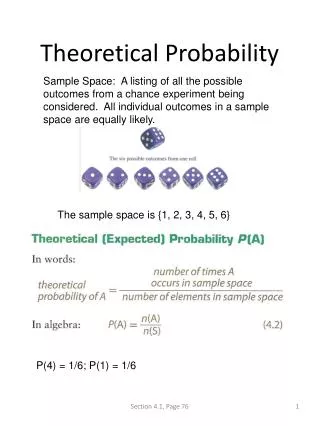
Example of use of Monte Carlo: , , , with mean x …….. Sample of n measurements: x x x x 1 2 3 n Unbiased estimate of population variance is calculated as: 2 2 2 2 + (x - x) + (x - x) + (x - x) + (x - x) …. 1 2 3 n (n – 1) The sum of squares is divided by (n – 1). If divided by n, the estimate would be biased too low. How can this be shown using Monte Carlo?
Use Gaussian (normal) random-number generator to generate (say) 100 000 numbers with mean 0 and standard deviation 1 (variance 1). Divide up these 100 000 numbers into 25 000 samples of 4 each (so n = sample size = 4). For each sample of 4, calculate the mean and unbiased variance using the formula with the correct (n – 1) = (4 – 1) = 3. Calculate and print out the average of these 25 000 means and 25 000 variances. For each sample of 4, repeat the calculation dividing the sum of squares by 4 instead of 3. Calculate and print out the average of these 25 000 variances. Next slide shows results of an actual Monte Carlo.
100 000 random numbers generated with Gaussian distribution and mean 0, standard deviation 1 (variance 1). Average of means of 25 000 samples of 4 each: 0.000184 Correct value: 0 Average of variances of 25 000 samples of 4 each (using correct divisor n – 1 = 4 – 1 = 3): 0.999975 Average of variances of 25 000 samples of 4 each (using incorrect divisor n = 4): 0.749979 Correct value: 1 so divisor n – 1 = 3 gives a much closer estimate of the population variance.
100 000 random numbers generated with uniform distribution between 0 and 1. Mean: 0.5, variance 1/12 = 0.083333. Average of means of 25 000 samples of 4 each: 0.499897 Correct value: 0.5 Average of variances of 25 000 samples of 4 each (using correct divisor n – 1 = 4 – 1 = 3): 0.083860 Average of variances of 25 000 samples of 4 each (using incorrectdivisor n = 4): 0.062895 Correct value: 1/12 = 0.083333. so divisor n – 1 = 3 gives a closer estimate of the population variance (but not as close as in the Gaussian case).