Download
1 / 43
440 likes | 533 Views
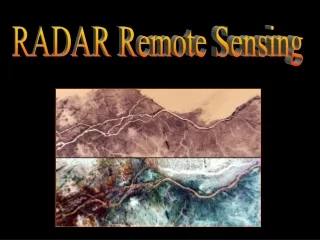
Radar Altimetry Johnny A. Johannessen Nansen Environmental and Remote Sensing Center, Bergen, Norway. OUTLINE PRINCIPLES OF ALTIMETRY FROM SATELLITE HEIGHT TO SURFACE HEIGHT GEOPHYSICAL PARAMETERS AND APPLICATIONS FUTURE ALITMETRY.

E N D
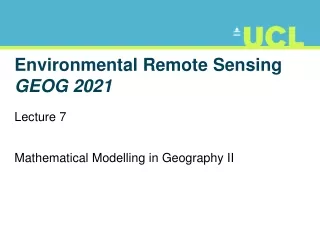
Radar Altimetry Johnny A. Johannessen Nansen Environmental and Remote Sensing Center, Bergen, Norway
OUTLINE • PRINCIPLES OF ALTIMETRY • FROM SATELLITE HEIGHT TO SURFACE HEIGHT • GEOPHYSICAL PARAMETERS AND APPLICATIONS • FUTURE ALITMETRY
OCEAN SURFACE QUANTITIES MEASURED FROM SPACE? SEA ICE WAVES SEA ICE THICKNESS CHLOROPHYLL GEOID & MDT SURFACE SALINITY SURFACE CURRENT NEAR SURFACE WIND SURFACE TEMPERATURE SEA LEVEL ICEBERG
Satellite altimetry coverage TOPEX/Poseidon Sampling Exact repeat orbits (to within 1 km) • Spatial coverage : • global • homogeneous • Nadir (not swath) • Temporal coverage : • repeat period • 10 days, T/P-Jason-1 • 35 days ERS/ENVISAT 1 measure/1 s (every 7 km) all weather (radar)
orbit error RA error Ionosphere Troposphere EM Bias Error Budget for altimetric missions Centimeters 100 90 80 70 60 50 40 EMR PRARE 30 TMR GPS/DORIS 20 10 0 Jason ERS T/P Geos 3 SEASAT GEOSAT
Principles of radar altimetry. • Active radar sends a microwave pulse towards the ocean surface, f = 13.5 Ghz • Precise clock onboard mesures the return time of the pulse, t t = 2d/c Centimetre Precision (10-8) from an altitude of 800 – 1350 km • Measures the backscatter power (wind speed) • Measures ocean wave height
x : t : Time to reach mid-power point : Back slope : Distance, R antenna mispointing Pu : Energy of the pulse : backscatter Coefficient, s SWH : Leading edge slope : Pb: Instrument noise Wave height t Physical parameters from the waveform t = 2d/c
Pulse Limited Footprint Full Area illuminated stays constant The full area has a radius R=(2hcp)1/2 Position of pulse t=T t=T+p t=T+2p t=T+3p Position of pulse t=T t=T+p t=T+2p t=T+3p
Sea State Effects Electromagnetic bias The concave form of wave troughs tends to concentrate and better reflect the altimetric pulse. Wave crests tend to disperse the pulse. So the mean reflecting surface is shifted away from mean sea level toward the troughs. Mean Sea Level Mean Reflecting Surface
Sea State Bias Skewness bias For wind waves, wave troughs tend to have a larger surface area than the pointy crests – the difference leads to a skewness bias. Again, the mean reflecting surface is shifted away from mean sea level toward the troughs The EM Bias and skewness bias (= Sea State Bias or SSB) vary with increasing wind speed and wave height, but in a non-linear way. SSB is estimated using empirical formulas derived from altimeter data analysis (crossover, repeat-track differences and parametric/non-parametric methods). The range correction varies from a few to 30 cm. EM bias accuracy is ~2 cm, skewness bias accuracy is ~1.2 cm. Empirical estimation of the SSB also includes tracker bias (depends on H1/3). .
Atmospheric Pressure Forcing Evolving atmospheric pressure field with highs and lows leads to spatial and temporal variation of the sea level pressure lows low high - - ++ - - - Sea surface +++ Bottom pressure Sea level rises (falls) as the low (high) pressure systems pass. The inverse barometer effect implies that 1 mbar of relative pressure change leads to a 1 cm sea level change
FROM SATELLITE HEIGHT TO SURFACE HEIGHT Orbit errors in position of satellite SSH = Orbit – Range – S Corr • Precision of the SSH : • Orbit error • Errors on the range • Instrumental noise • Various instrument errors • Various geophysical errors (e.g., atmospheric attenuation, tides, inverse barometer effects, …)
SSH = Geoid + dynamic topography + «noise» • hg : geoid 100 m • hd : dynamic topography 2 m • hT : tides 1-20 m • ha : inverse barometer 1 cm/mbar
OCEAN DYNAMICS FROM ALTIMETRY LARGE SCALE SSH ANOMALIES MESOSCALE VARIABILITY PLANETARY WAVES SEA LEVEL CHANGE
Mesoscale variability T/P Jason-1 ENVISAT Jason-1 + ENVISAT
Sea surface -- + + + West East horizontal plane Pressure force North Vertical plane Pressure force Coriolis force West East South Geostrophic Currents Geostrophic Balance : Horizontal gradients in the pressure field create a downgradient force. On a rotating earth this is balanced by the Coriolis force. N Hemisphere : high P is to the right of the flow. S Hemisphere : high P is to the left of the flow.
Geostrophic Currents from altimetry B A With altimetry, we measure the sea surface height along a groundtrack. Geostrophic currents calculated from the alongtrack slope will be perpendicular to the groundtrack. Groundtrack A Groundtrack B h’ h’ v’ v’ Groundtrack A perpendicular to slope : strong currents Groundtrack B parallel to slope : weak currents
IMPORTANCE OF MAPPING FREQUENCY AND COVERAGE EKE estimated with 4 satellites missions (Jason-1, T/Pi,ERS-2/ENVISAT,GFO) Units are in cm2/s2 0 800 EKE differences between 4 and 2 satellites missions Units are in cm2/s2 Courtesy of CLS 0 400
IMPORTANCE OF MAPPING FREQUENCY AND COVERAGE Cyclonic eddy of the Gulf Stream. 2 ALTIMETERS LEFT 4 ALTIMETERS RIGHT Courtesy of CLS
PLANETARY WAVES Surface Layer (warmer, lighter) Deep Layer (cooler, denser)
Hovmuller diagrams and propagating Rossby waves Sea Level Variance Courtesy of Remko Scharroo, DEOS, TU Delft, NL
Computation of Mean Dynamic Topography (MSS - Geoid) Compute the geoid relative to the TP ellipsoid and in the mean tide system Substract the geoid from the mean sea surface Apply a Gaussian filter with a 400 km width MDTS Geoid MSS CLS01-EIGENGL04S cm m geoid From GUTS Study, Courtesy of Rio, 2007
CRYOSAT 2 - Altimeter Thickness Observations after Laxon
T H A N K Y O U
Principles of radar altimetry Beam limited footprint < pulse limited footprint Pulse limited Beam limited L L:antenna size :wavelength d d L = B/2d B=d/L (P/2)2 + d2 = (d+ c2 P = 2(2cd)1/2 Pulse length = c B P