1 / 0

Osteoarthritis 101

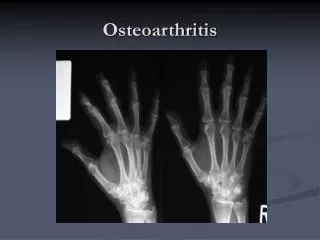
Osteoarthritis 101. Jacek A. Kopec STAR Webinar March 4, 2011. What is OA?. Knee OA on X-ray . From the Arthritis Society Website http ://www.arthritis.ca/local/files/pdf%20documents/Types%20of%20Arthritis/TAS_OA_eBROCH_ENG_S.pdf. DID YOU KNOW?

rhonda
Download Presentation

Osteoarthritis 101

An Image/Link below is provided (as is) to download presentation Download Policy: Content on the Website is provided to you AS IS for your information and personal use and may not be sold / licensed / shared on other websites without getting consent from its author. Content is provided to you AS IS for your information and personal use only. Download presentation by click this link. While downloading, if for some reason you are not able to download a presentation, the publisher may have deleted the file from their server. During download, if you can't get a presentation, the file might be deleted by the publisher.

E N D

Presentation Transcript


  1. Osteoarthritis 101

    Jacek A. Kopec STAR Webinar March 4, 2011
  2. What is OA?
  3. Knee OA on X-ray
  4. From the Arthritis Society Website http://www.arthritis.ca/local/files/pdf%20documents/Types%20of%20Arthritis/TAS_OA_eBROCH_ENG_S.pdf DID YOU KNOW? Osteoarthritis (OA) is the most common type of arthritis; it affects 1 in 10 Canadian adults. It affects women and men equally (past 60). Anyone can get OA, but it usually starts in the 40’s to 50’s and is more common as we continue to age. There is no cure for OA, but when you are diagnosed early and start the right treatment, you can take control of your disease and avoid severe damage to your joints.
  5. Diseases by DALY (USA)
  6. Joints affected by OA End joints of fingers Middle joints of fingers Joint at base of thumb Hips Knees Joints at base of big toe Ankles Neck (cervical spine) Low back (lumbar spine)
  7. Prevalence of symptomatic-radiographic OA (USA) Total (25+) = 13.9% Total (65+) = 33.6% Knee (60+) = 12.1% (13.6% female; 10.0% male) Hip (55+) = 4.4% (3.6% female; 5.5% male) Hand (60+) = 8.0% (8.9% female; 6.7% male) Feet (15-74) = 2.0% (3.6 female; 1.6 male)
  8. Incidence of symptomatic-radiographic OA (USA) Knee OA = 2.40 per 1000 person years Hip OA = 0.88 per 1000 person years Hand OA = 1.00 per 1000 person years
  9. Modeling of OA All models are Total Models of the Universe with various sets of simplifying assumptions A friend of a friend All models are wrong, but some are useful George A.P. Box Warning: computer simulation – may be erroneous and unverifiable… Michael Critchon
  10. What is a model? A models is a graphical, mathematical (symbolic), physical, or verbal representation or simplified version of a concept, phenomenon, relationship, structure, system, or an aspect of the real world (Online Business Dictionary)
  11. POHEM-OA A model of osteoarthritis Source: Okhmatovskaia A, STAR website, 2010
  12. Risk factors for OA Age Gender Family history Race/ethnicity Congenital joint abnormalities SES (?) BMI Joint injury Heavy physical activity (sports, occupational) Other (?)
  13. POHEM-OA: BMI, OA incidence and HRQOL Region Income Education BMI Linear regression model (NPHS) Age & Sex Survival regression model (NPHS) Incidence rates (BCLHD) OA Diagnosis Tobit regression model (CCHS) HRQOL Source: Kopec JA et al, Osteoarthritis & Cartilage, 2009; 18:303-11
  14. Prevalence of OA in BC in 2001 (admin data, 1 visit) Total (all ages): 10.8% Age ≥20: 14.3% Men (all ages): 8.9% Women (all ages): 12.6%
  15. Incidence of OA in BC in 2001 (admin data, 1 visit) Total (all ages): 11.7 / 1000 p-y Age ≥20: 16.2 / 1000 p-y Men (all ages): 10.0 / 1000 p-y Women (all ages): 13.4 / 1000 p-y
  16. Prevalence by age and sex for 2 definitions of OA (BC)
  17. Incidence by age and sex for 2 definitions of OA (BC)
  18. OA prevalence and incidence in BC by run-in period
  19. Estimating OA prevalence in 2001 in POHEM Source: Flanagan W et al: OARSI Conference, October 2008
  20. Self-reported OA prevalence in CCHS(12+)
  21. POHEM-OA projections (20+) vs. SROA in CCHS (12+)
  22. Trend in OA incidence in BC
  23. OA Treatment Pain medication Physiotherapy Self-management Surgery (joint replacement) Other
  24. POHEM-OA: drug use and effects Age & Sex OA duration surgery Logistic regression PHARMANET NPHS OA drugs Tobit regression model (CCHS) Literature Tobit regression model (CCHS) Side effects Literature (RCTs) conversion to HUI Literature HRQOL
  25. Use of medication in OA
  26. Use of medication in OA
  27. Effect of medication on pain in OA
  28. Complications of medication in OA: excess rate per 1000
  29. Impact of common side-effects of medication in OA
  30. POHEM-OA: surgical treatment (joint replacement) Age & Sex Survival curves (2-piece Weibull) (BCLHD) Survival curves (2-piece Weibull) (BCLHD) Survival curves (2-piece Weibull) (BCLHD) Visits to surgeons Primary surgeries Revisions Linear regression (VGH Cohort) Linear regression (VGH Cohort) Drop in HRQOL (VGH Cohort) Literature HRQOL
  31. Projected prevalence of OA in Canada Source: Kopec JA et al, EULAR Conference, June 2009
  32. Uncertainty in OA prevalence projection (due to BMI RR) Source: Behnam Sharif, PhD Student, SPPH, 2010
  33. Burden of OA in Canada attributable to obesity Attributable prevalence by 2021= 13.4% Source: Kopec JA et al, EULAR Conference, June 2009
  34. OA burden in Canada: HALE Source: Kopec JA et al, EULAR Conference, June 2009
  35. Thank you

  36. Effect of BMI on OA incidence
  37. Reference OA incidence rates
  38. Effects of age, sex, OA and BMI on HUI3
More Related