Download
1 / 75
760 likes | 937 Views
Genome Sequence Informatics & Comparative Genome Sequence Analysis. Niclas Jareborg AstraZeneca R&D Södertälje. Genome sequencing projects. Aim : Better understanding of biology Bioinformatics Manage data Cut corners Generate and test new hypotheses Make the most of the data

E N D
Genome Sequence Informatics&Comparative GenomeSequence Analysis Niclas Jareborg AstraZeneca R&D Södertälje
Genome sequencing projects • Aim: Better understanding of biology • Bioinformatics • Manage data • Cut corners • Generate and test new hypotheses • Make the most of the data • comparative analysis
gttaaaattcagcaggcagaatgaaaataaatgtcaataattttttattt taaaatattcatgttttactattttgatataatttttaaagaaaaaggca gaaaccactgcttattagaaggcagattttattgattttatacccctaga cttgttgcatatcaaacctatgtaaaaacatctataaatcaaatcattaa ttgcacctagtataataattctatatatggaggtaatgtttgattcttca ggagctttaataacttgaagcccgtttgattgctttaaaatgatttctca ttgtatttgtttatattgtatcattaagcaaaagtacagagtaagcaatt agtgtgattaattcctcttccataatacagtaaagcactgcctccataga ccaattctctgggatccctggaaaacatctggcatccagcaagtcttgac ccctctttagaaagccatggagaaactggaggcaattctgttaattattt gccctctagaggcaattgggttaattaccctcccttccctatccatgaca caatttctccagttacatgtagaatgctgttatgtgtctcctgaccagac cccttatttcatagatgtggaaactgaggccatgaaggatgaggtgactg ttcacaatccacatggctagttagtgtccagagcctggcctggacttctc tcttgttctggggccttgagttctctccctcttctttagtacatatggcc acaggtaacgtaatctgcgtaccacatttgcatttggagtgcatctgttt tgcattcatttaatcttgttgagatggtttgcttgttgacctactcagtc agttatcttttcacctttgtgagttgagagctttgtgtattaaatctgta aaactttgcatcgtggaaagtgacataatctgtagcagacccatgctgtt tttagatgcatcttcattgtggtagtgacagtgattgagaaactttacat Where are the functional elements?
Features in genome sequences • Genes • Exons, introns, promoters • RNA genes • CpG islands • Enhancers • Other functional elements • e.g. Replication origins, Nuclear matrix association • Repeats
How to find genomic features • Repeats, CpG islands, RNA gene • Bioinformatics programs • Genes • Homology to known sequences • Bioinformatics prediction programs • Transcription regulatory regions • Bioinformatics prediction programs
Finding genes by homology • Database searches – BLAST, BLAT, SSAHA • EST and cDNA sequences • Protein sequences High accuracy, misses unknown sequences • caveat: junk EST sequences
Genewise (Birney & Durbin) Alignment of DNA to protein (or HMM) allowing for splicing Uses dynamic programming with extra states for introns
-20bp pkinase.hmm 1 YELGEKLGEGA GKVYKAKHK---TGKIVAVKILKKESLSLL REIQI ++ LG + G+ Y+A + ++I+ + +K + + + E+ + INIKNLLGGDT GCLYMAPKVQATKQQIYKLCFIKIKTFVLQ TELNL HSU71B4 -27753 aaaaactgggaGTGTGAGTA Intron 1 CAGTgtttagcagcgaaccatatttaaaaatgccAGGTCACTA Intron 2 CAGGagcac tataattggac <2-----[27718:22469]-2> ggtatccataccaaataatgttatacttta <2-----[22375:21185]-2> catat atcatggtata acatgaaaaaaaaaattagcctaaattgta tacct pkinase.hmm 45 LKRLN-HPNIVRLLGVFED-----SKDHLY LVLEYMEGGDLFDYLRRKG--PLSEKEAKKIALQILR L++++ H+NIV ++G+F L+ +V+E++ G+ D++R+ L E+++ +I ++IL+ LRKYSFHKNIVSFYGAFFKLSPPGQRHQLW MVMELCAAGSVTDVVRMTSNQSLKEDWIAYICREILQ HSU71B4 -21168 caatttcaaagtttggttacaccgccccctGTATGTT Intron 3 CAGagagttgggtgagggaaaaacataggtagtatcgacc tgaactaaattctagcttatgccgagaatg<0-----[21078:15667]-0>tttatgccgctcattgtcgaagtaaagtcatggatta gggctccactgcctaatcggtcttggcatg ggggataatgcttagagcttgtaaatgtttccaactg pkinase.hmm 104 GLEYLHSNGIVHRDLKPENILLDENGTVKI DFGLAKLLK-SGEKLTTFV GL++LH ++++HRD+K +N+LL++N VK+ DFG++++++ ++++++F+ GLAHLHAHRVIHRDIKGQNVLLTHNAEVKL DFGVSAQVSRTNGRRNSFI HSU71B4 -15555 GTGAGTC Intron 4 CAGgtgcccgccgaccgaagcagccacagggacGGTAAGTT Intron 5 CAGTTgtggagcgaaaagaaaata <0-----[15555:14066]-0>gtcatacagttagatagaatttcaacatat <1-----[13974:10915]-1> atgtgcatggcagggagtt catctcacaatcgccatgtgggttttaaag ttagtcggcattaagttct pkinase.hmm 153 GTPWYMMAPEVILKG-----RGYSTK VDVWSLGVILYELLTGKL FPG-D GTP++M APEV + R Y+ + +DVWS+G++ +E++ G + + GTPYWM-APEV-IDCDEDPRRSYDYR SDVWSVGITAIEMAEGAP LCNLQ HSU71B4 -10855 gactta gcgg agtgggcacttgtaGTGAGTG Intron 6 CAGaggttggaagagaggggcCGTGAGTA Intron 7 CAGCTctacc gccagt ccat tagaaacggcaaag<0-----[10783: 8881]-0>gatgctgtcctatcagcc <1-----[8825 : 4234]-1> tgata gaacgg atgg tcttgcaaccttca ttggtgattctagtaact gtcta pkinase.hmm 196 PLEELFRIKKRLRLPLPPNC SEELKDLLKKCLNKDPSKRPTAKELLEHPW PLE+LF I+++ ++ + ++ S+ + +++KC K+ RPT +L+HP+ PLEALFVILRESAPTVKSSG SRKFHNFMEKCTIKNFLFRPTSANMLQHPF HSU71B4 -4214 ctggctgatcgtgcagatagTGGTAAAGA Intron 8 TAGGtcatcatagataaaatctccatgaacccct ctactttttgacccctacgg <2-----[4154 : 3085]-2> cgataattaagctaatttgccccattaact cgatccttggattcacacca ctgcctcgagtgaatcgtttttacgtacat - 6bp +12bp +3bp - 66bp - 8bp - 1bp 0bp - 3bp -1 bp +2bp +1bp +1bp
easy hard Gene prediction methods • ATGs • Stop codons • ORFs • Coding preference • Splice sites • profiles, statistical methods, neural networks etc. High coverage, low accuracy
Accuracy of gene-finding programs for 1.4 MB genomic region BRCA2 on humanchromosome 13q Region includes 159 true exons exact match overlap exons 5'- splice site 3'- splice site NE N acc cov N acc cov N acc cov N acc cov fgenesh.masked 169 110 0.65 0.69 125 0.74 0.79 118 0.70 0.74 116 0.69 0.73 fgenesh 190 109 0.57 0.69 126 0.66 0.79 117 0.62 0.74 117 0.62 0.74 fgenes.masked 238 103 0.43 0.65 132 0.55 0.83 114 0.48 0.72 118 0.50 0.74 fgenes 281 104 0.37 0.65 136 0.48 0.86 116 0.41 0.73 120 0.43 0.75 genscan 292 105 0.36 0.66 129 0.44 0.81 116 0.40 0.73 115 0.39 0.72 fgeneh 381 68 0.18 0.43 101 0.27 0.64 79 0.21 0.50 87 0.23 0.55 mzef 623 95 0.15 0.60 122 0.20 0.77 106 0.17 0.67 107 0.17 0.67 fgeneshm+genescan 118 97 0.82 0.61 106 0.90 0.67 101 0.86 0.64 101 0.86 0.64 fgeneshm+fgenes 89 83 0.93 0.52 86 0.97 0.54 86 0.97 0.54 83 0.93 0.52 acc - specificity (true predicted/all predicted) cov - sensitivity (true predicted/true) NE - number of predicted exons data provided by Tim Hubbard and Richard Bruskiewich (Sanger Centre)
Repetitive elements • 1/3 of the human genome • Transposable elements • LINEs (Long Interspersed Nuclear Elements), 6-8 kb • SINEs (Short Interspersed Nuclear Elements, e.g. Alu), 100-400 bp • Retrovirus-like elements, 1.5-10 kb (LTRs 300-1000 bp) • DNA transposons, 80 bp-3 kb • Tandem repeats • Simple repeats/Microsatellites (1-5bp)n, e.g. caacaacaa • Minisatellites (6-1000s bp)n • Low complexity regions
Repeat masking • Repeats disturb analysis • Homology searching • Gene prediction • Masking exchange repeat region with N's. Will be ignored by analysis programs • RepeatMasker(Smit & Green) • LINEs, SINEs, LTR transposons, DNA transposons, Simple repeats, Low complexity regions • trf (Benson) • Tandem repeats
Predicting regulatory regions • Transcription Factor Binding Sites (TFBSs) have very low information content • Given a long enough sequence a binding site will be predicted • Combination of TFBSs • Even the best algorithms will overpredict
CpG islands • Associated with transcribed genes • House keeping genes + ~50% of other genes • Often in 5' ends of genes • >200 bp • GC content >50% • obs/exp CpG >0.6
Gene Ontology • “Controlled vocabulary that can be applied to all organisms even as knowledge of gene and protein roles in cells is accumulating and changing.” “Biologists would rather share a toothbrush than a gene name” - Michael Ashburner
Gene Ontology • Organizing principles • Molecular function • Biological process • Cellular component • Hierarchical structure
Genome resources • Genome sequence centered • Ensembl • http://www.ensembl.org • NCBI • http://www.ncbi.nlm.nih.gov • UCSC Human genome browser • http://genome.ucsc.edu • All based on NCBI assembly • Gene centered • SOURCE • http://source.stanford.edu • GeneLynx • http://www.genelynx.org • GeneCards • http://bioinformatics.weizmann.ac.il/cards/
Genomic resources Transcripts Protein sequences Protein structure and domains Protein function and disease links Homologs Functional/GO classifications Physical clones etc Gene-centered resources
Comparative Genomic Sequence Analysis • Aid in finding functional regions • Coding regions • Regulatory regions
Comparative Genomic Sequence Analysis • Compare corresponding genomic sequences from different species • Potential protein coding and/or regulatory regions can be identified by their conservation • “Phylogenetic footprinting”
Synteny maps • Maps corresponding regions in different genomes • Large-scale relationships • Based on • genetics • sequence • Available for • Human vs. • Mouse • Rat • Dog • Chimp • etc… • Mouse vs Rat
Ensembl synteny views • Protein sequence based
NCBI comparative maps • Based on genetics • Several genetic maps
Human/vertebrate sequence comparisons (80-450 Myrs) • Coding sequences generally well conserved • Non-coding regions show highly variable levels of conservation • Conservation of non-coding regions imply a functional role • promoters • other transcriptional regulators • replication origins • chromatin condensation • matrix association
Model organisms for vertebrate comparative analysis • Not too evolutionary close • Impossible to identify functional regions through conservation • Mouse 3000 Mb 80 Myrs • Genetics • Sequence ”finished” • Chicken 1200 Mb 300 Myrs • Micro-chromosomes (~75% of genes) • Prioritized for sequencing • Fugu (Puffer fish) 400 Mb 450 Myrs • Small genome, shorter introns and intergenic regions • More or less the same gene content as higher vertebrates • Sequence finished
What are we comparing? • Homologue • common ancestor, may have similar function • Orthologue • the “same” sequence, generated by a speciation event, probably same function • Paralogue • similar sequence within species, generated by a gene duplication event, may have similar function
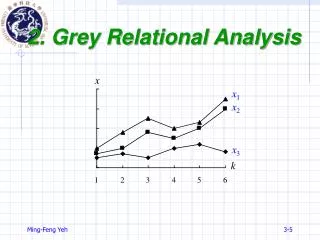
Finding conserved regions • Dot plot • Dotter • Similarity search programs • Blast • Alignment programs • DBA (Jareborg et al) • blastz (Schwartz et al.) • Dialign (Morgenstern et al.) • WABA (Kent & Zahler) • Avid (Bray et al.) • others
Dotter (Sonnhammer & Durbin) • Graphical dot plot program for detailed comparison of two sequences • Features • dynamic greyscale ramp for stringency cut-off • alignment viewer • zooming. • Unix & Windows • http://www.cgb.ki.se/cgb/groups/sonnhammer/Dotter.html
DBA (Jareborg, Birney & Durbin) • DNA Block Aligner • Finds co-linear blocks with high similarity • Does not try to align the sequences between these blocks • Divides blocks into four different categories • approx. 60-70%, 70-80%, 80-90%, 90-100%
Comparison-based functional prediction • Gene prediction • Regulatory region predictions
”Comparative” gene prediction programs • Twinscan • Doublescan • SGP-1 http://genes.cs.wustl.edu/ http://www.sanger.ac.uk/Software/analysis/doublescan/ http://195.37.47.237/sgp-1
Regulatory region prediction • Consite • Detection of TFBS conserved in corresponding genomic sequences from different species • www.phylofoot.org/consite