Download
1 / 61
610 likes | 731 Views
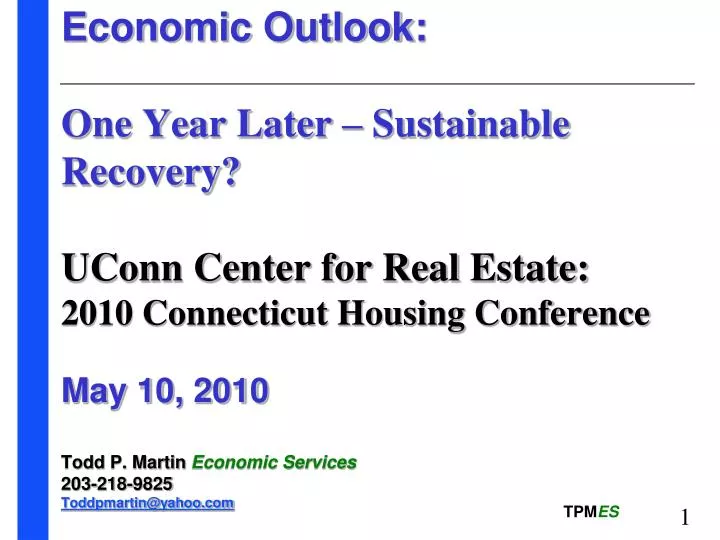
Economic Outlook: One Year Later – Sustainable Recovery? UConn Center for Real Estate: 2010 Connecticut Housing Conference May 10, 2010 Todd P. Martin Economic Services 203-218-9825 Toddpmartin@yahoo.com. Economic Outlook . US Economic Backdrop .

E N D
Economic Outlook: One Year Later – Sustainable Recovery? UConn Center for Real Estate: 2010 Connecticut Housing Conference May 10, 2010 Todd P. Martin Economic Services 203-218-9825 Toddpmartin@yahoo.com
US Economic Backdrop • After worst post-war recession on record, US GDP growth rebounds during second half of 2009 due to massive fiscal and monetary policy responses – job creation is still weak, however • The Fed will begin tightening monetary policy by year end 2010 (Fed Funds increase to 1%?) – Discount rate increased to 0.75% recently, short-term funding programs largely unwound – “Exit Strategy” will be tricky • Uncertainty about huge potential federal policy initiatives (Health Care, Cap-and-trade, tax legislation, Fin. Regulation, etc.) have paralyzed private sector investment plans and consumer confidence. InterestingNovember elections! • Lots of worries: Sovereign debt, state and local budget squeeze, commercial RE, “real’ unemployment rate, foreclosures, ARM resets, bank lending and failures, etc. • Tailwinds: low inflation, pent-up demand, higher stock prices, ISM rebound, inventory rebuilding, exports, awareness finally leads to action on deficits?
US Economic Backdrop cont. • Forecast for moderate expansion (3% GDP 2010) but unemployment rate remains elevated (9.0% - 9.5% +) “U” rather than “W”? • Housing sector remains depressed – but performance varies by region. Inventories correcting, prices trying to stabilize – foreclosures loom as unemployment climbs, 25% upside down. $3.4 trillion commercial RE debt under pressure, 45% held by banks - $1.4 trillion coming due 2010-14 (half, upside down) • Trade deficit narrows sharply, dollar strengthens – Obama’s $3.8 Trillion Budget raises the Federal budget deficit to 11% of GDP! Unsustainable • Risks: • Downside: Job growth (wages), further housing sector erosion, commercial RE – small bank exposure, continued uncertainty – lack of confidence • Upside: Pessimism rampant and news may be discounted by the markets?. Unprecedented fiscal & monetary policy responses, pent-up demand.
GDP rebounds; has unemployment peaked? • Source: Wall Street Journal, Briefing.com, BEA, BLS
The recession was twice as bad “average” Sources:New England Economic Partnership, NBER, BEA, FRB, BLS, Moody’s Economy.com
…And taking longer to recover • Source: Wall Street Journal, BEA, BLS
U.S. Economy is finally creating some jobs • Source: Briefing.com, BLS
It could take 6 years to recover jobs lost • Source: Wall Street Journal, BLS
Trend in Initial Jobless Claims improving…. Source: Federal Reserve Bank of St. Louis, BLS
…but long-term unemployment at all-time high Source: Federal Reserve Bank of St. Louis, BLS
Solid recovery in manufacturing • Source: Wall Street Journal, Briefing.com, Federal Reserve, ISM
“Core” inflation rate continues to trend lower • Source: Wall Street Journal, Briefing.com, BLS
Leading indicators up - lots of excess capacity • Source: WSJ, Briefing.com, Conference Board, Stone & McCarthy Research Federal Reserve
TED Spread shows easing of financial stress Spread between 3 month Libor and T-bill yields Subprime financial shock [Good news? Patient out of Intensive Care?] S&L crisis LTCM Orange County Y2K Tech bust Thai baht Peso crisis Source: Federal Reserve H-15, Moody’s Economy.com
Stock prices up 70% from lows Source: Wall Street Journal,TPM Economic Services
Fed at the cusp of tightening policy? "The Committee will maintain the target range for the federal funds rate at 0 to 1/4 percent and continues to anticipate that economic conditions, including low rates of resource utilization, subdued inflation trends, and stable inflation expectations, are likely to warrant exceptionally low levels of the federal funds rate for an extended period.“ “In light of improved functioning of financial markets, the Federal Reserve has closed all but one of the special liquidity facilities that it created to support markets during the crisis..” “Information received since the Federal Open Market Committee met in March suggests that economic activity has continued to strengthen and that the labor market is beginning to improve. Growth in household spending has picked up recently but remains constrained by high unemployment, modest income growth, lower housing wealth, and tight credit.” FOMC Press Release - 4/28/10
How will the Fed’s exit strategy work? Source: Federal Reserve, Wall Street Journal
Huge expansion of the Fed’s B/S The Fed's balance sheet has more than doubled in size since the Lehman bankruptcy. The focus of policy-makers has been on the asset side of the balance sheet, so-called "Credit Easing". Source: Federal Reserve, Stone & McCarthy Research
If banks ever start lending -- Wow The explosion on the asset side of the balance sheet was matched by an offsetting explosion on the liability side of the balance sheet, especially an explosion in bank reserve balances held at the Fed. These reserve balances represent immediately available funds. Source: Federal Reserve, Stone & McCarthy Research
Consumers are still worried…. Source: Wall Street Journal, Briefing.com, Conference Board
…. But spending increases marginally Source: Stone & McCarthy Research
Global Governments in the Red Source: IMF, OECD, Wall Street Journal
Greece is not alone with fiscal problems Source: White House OMB, Wall Street Journal
Obama’s proposed budget is stunning Please see USdebtclock.org for real-time analysis of federal debt & deficit Source: White House OMB, Wall Street Journal
“It’s the spending stupid” Source: Heritage Foundation, Census Bureau & OMB, Wall Street Journal
Taxes headed higher – No Trust in Gov. Source: Wall Street Journal, Tax Policy Center, Pew Research Center
State Budgets in very poor shape Source: Wall Street Journal, Census Bureau, Rockefeller Institute
Housing starts forming a bottom? Source: NAR, Stone & McCarthy Research
Inventories down and trend in prices turning Source: Stone & McCarthy Research, Census Bureau, S&P Case Shiller, FHFA
High level of foreclosures & delinquencies Source: BLS, Stone & McCarthy Research
FL, NV, AZ, MI, and CA Hit the hardest Source: Wall Street Journal, LPS Applied Analytics
They also have the largest price declines Projected home price correction from peak to trough, % U.S. = -37.0% > -4% -4% to -11% -11% to -37% < -37% Source: Fiserv, FHFA, Moody’s Economy.com
Location, Location, Location… Source: Wall Street Journal, Zelman & Assoc.
Shadow Inventory will keep lid on prices Source: Wall Street Journal, Barclays Capital, RealtyTrac, LPS Applied Analytics
Detroit: As bad as it gets Source: Wall Street Journal
Continued Credit Risks Commercial Real Estate: $3.4 trillion [3,000Community Banks have exposure] The Moody's/REAL Commercial Property Price Index - 43% from 2007 peak. $1.4 Trillion MBS coming due 2010-14 Consumer Credit: $900 billion in credit-card debt outstanding – 1/3rd owned by Sub-prime borrowers? Municipal Debt: The $3 trillion More housing trouble: Nearly 10.7 million homeowners, 23% upside-down [NV=64%] – Foreclosure pipeline = 3-7 million? Sovereign Debt: Greece, Portugal, Italy, Spain Source: Wall Street Journal
$1-10 billion banks at increased risk Source: FDIC Quarterly Banking Profile
More Deleveraging to come? Source: Wall Street Journal
CT Economic Outlook • Connecticut Economy is slowly beginning to add back some of the 103,000 jobs lost during the recession. 6,400 net new jobs have been created over the last 3 months. • Unemployment rate continues to move higher, however – at 9.2% in March (below the US rate of 9.7%) • State & Local fiscal continues to deteriorate as tax revenues slow and spending outpaces inflation or population growth. General Assembly avoids making tough choices – huge unfunded liabilities among the worst in the U.S. • CT was not immune to Housing recession, but was not as exposed as other areas of the country. Sales & prices down, marketing times up.
CT lost 103,000 jobs during the recession Down 30,600 (1.9%) YOY Source: BLS, TPM Economic Services
CT Unemployment rate continues to climb 9.2% as of March 2010 Source: BLS, TPM Economic Services
Construction has lost 17,000 jobs, or 24% from peak Down 4,600 (8.1%) YOY Source: BLS, TPM Economic Services
CT Financial jobs stronger than expected Down 10,300 (7.1%) from peak Source: BLS, TPM Economic Services
CT Manufacturing Jobs down 45% since 1990s Down 7,300 (2.9%) from peak Source: BLS, TPM Economic Services
Where CT has lost jobs over the last 12 months Change in CT Non-Farm Employment Mar. 2010 vs. Mar. 2009 ( Not SA) Source: CT Labor Department, TPM Economic Services
Where jobs were created last year Change in CT Non-Farm Employment Mar. 2010 vs. Mar. 2009 ( Not SA) Source: CT Labor Department, TPM Economic Services
Largest % job losses year-over-year Change in CT Non-Farm Employment Mar. 2010 vs. Mar. 2009 ( Not SA) Source: CT Labor Department, TPM Economic Services
Largest % gain in jobs last year Change in CT Non-Farm Employment Mar. 2010 vs. Mar. 2009 ( Not SA) Source: CT Labor Department, TPM Economic Services
Rare decline in personal income last year 2010-2014 is forecast Source: U.S. Commerce Dept., CT DOL, DataCore Partners, Economy.com