Download
1 / 77
1.03k likes | 1.75k Views
Bruce W. Bode, MD FACE Atlanta Diabetes Associates Associate Professor of Medicine Emory University School of Medicine. Management of Inpatient Hyperglycemia: Review of Recent Trials and Guidelines. Financial Relationships. Grant/Research Support: Sanofi-Aventis, Lilly USA, Novo Nordisk

E N D
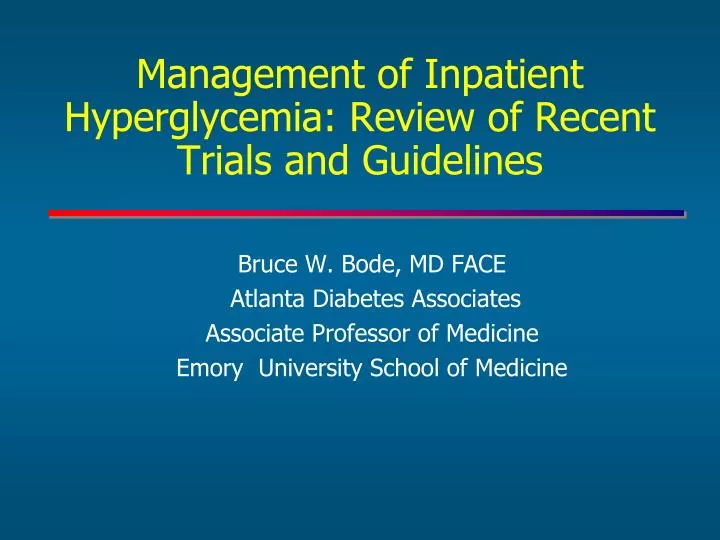
Bruce W. Bode, MD FACE Atlanta Diabetes Associates Associate Professor of Medicine Emory University School of Medicine Management of Inpatient Hyperglycemia: Review of Recent Trials and Guidelines
Financial Relationships Grant/Research Support: Sanofi-Aventis, Lilly USA, Novo Nordisk Consultant: Sanofi-Aventis, Lilly USA, Novo Nordisk Speaker’s Bureau: Sanofi-Aventis, Lilly USA, Novo Nordisk Major Stock Shareholder : Glytec
Diabetes Today: An Epidemic • In 2008, ~26 million Americans (12% of the population) were diagnosed with diabetes1 • In 2008, 40% of Americans >age 20 have either pre-DM or DM • Complications of diabetes are a major cause of mortality and morbidity1 • >224,000 deaths • 82,000 lower-limb amputations • 44,000 began treatment for end-stage kidney disease • 12,000-24,000 new cases of blindness each year • Total cost in the United States in 2002: $132 billion1
Hyperglycemia Is Prevalent at Hospital Admission 38% of all patients at admission have hyperglycemia – Of those patients, nearly one-third have no history of diabetes Single-center, retrospective chart review of 1886 patients hospitalized over 15 weeks in a community teaching hospital. Hyperglycemia defined as BG ≥126 mg/dL on admission or while fasting, or random BG ≥200 mg/dL on ≥2 occasions. Umpierrez GE et al. J Clin Endocrinol Metab. 2002;87:978-982.
Hospitalizations Account for the Largest Portion of the Direct Costs of Diabetes Care 2007 Total Direct Cost = $116 billion 50% American Diabetes Association. Diabetes Care. 2008;31:596-615.
Hyperglycemia: Scope of the Problem No Diabetes Diabetes 50 40 30 20 10 0 50 40 30 20 10 0 26% Patients, % 78% <110 110-140 140-170 170-200 >200 <110 110-140 140-170 170-200 >200 Mean BG, mg/dL Kosiborod M, et al. J Am Coll Cardiol. 2007;49(9):1018-183:283A-284A.
Hyperglycemia and Mortalityin the MICU ~4x ~3x 45 45 45 40 40 40 ~2x 35 35 35 30 30 30 25 25 25 Mortality Rate (%) 20 20 20 15 15 15 10 10 10 5 5 5 0 0 0 80-99 100-119 120-139 140-159 160-179 180-199 200-249 250-299 >300 Mean Glucose Value (mg/dL) N=1826 ICU patients. Krinsley JS. Mayo Clin Proc. 2003;78:1471-1478.
Intensive Insulin Managementin Medical-Surgical ICU P < 0.001 P < 0.002 29.3% Reduction Mean BG Levels(mg/dL) Hospital Mortality (%) Baseline group (n = 800) Glucose management group (n = 800) Krinsley JS. Mayo Clin Proc. 79:992-1000, 2004.
Hyperglycemia: A Predictor of Mortality Following CABG in Diabetics First Postop Glucose >200 • 2x LOS • 3x Vent duration • 7x mortality !!! 10 P<0.0001 8.6 BG >200 BG <200 n=1369 n=662 8 Postop 5.0% * 1.8% Mortality 5.8 *P<0.001 6 Postop Mortality (%) Adjusted for 19 clinical and operation variables 3.8 4 2.1 1.7 2 1.4 0 175- 200- 225- 150- >250 <150 CABG, coronary artery bypass graft. 200 225 250 175 Blood Glucose (mg/dL) Furnary AP et al. Circulation. 1999:100 (Suppl I): I-591.
Intensive Insulin Therapy in Critically Ill Patients: The Leuven SICU Study Randomized controlled trial: 1548 patients admitted to a surgical ICU, receiving mechanical ventilation. Patients were assigned to receive either: • Conventional therapy: IV insulin only if BG >215 mg/dL • Target BG levels: 180-200 mg/dL • Mean daily BG: 153 mg/dL • Intensive therapy: IV insulin if BG >110 mg/dL • Target BG levels : 80-110 mg/dL • Mean daily BG: 103 mg/dL Van den Berghe et al. N Engl J Med. 2001;345:1359-1367.
Intensive Insulin Therapy in Critically Ill Patients: SICU * * * * * * *P<0.01 Relative Risk Reduction (%) Van den Berghe et al. N Engl J Med. 2001;345:1359-1367.
Benefits of Tight Glycemic Control: Observational Studies and Early Intervention Trials *RCT, randomized clinical trial. Kitabchi & Umpierrez. Metabolism. 2008;57:116-120.
Medical ICU Study Results In-hospital mortality for patients who were in the ICU and on CII for >3 days was lower (52.5% to 43.0%) - RRR=18.1% P=.009 In-hospital morbidity was lower - Reduction in newly acquired kidney injury - Weaning from mechanical ventilation - Discharge from ICU; discharge from Hospital Hypoglycemia was an independent risk factor for mortality Van den Berghe et al. N Engl J Med. 2006;354:449-461
Tight Glycemic Control Decreased Morbidity in Medical ICU Patients Weaning From Mechanical Ventilation Discharge From ICU Discharge From Hospital 4.0 4.5 5 P=.03 P=.05 P=.04 4.0 3.5 4 3.5 3.0 Intensive treatment 3.0 2.5 3 2.5 2.0 Cumulative hazard 2.0 Conventional treatment 2 1.5 1.5 1.0 1.0 1 0.5 0.5 0 0 0 0 10 20 30 40 50 60 70 80 90 0 20 40 60 80 100 0 100 200 300 400 500 600 Days after admission to ICU Prospective, randomized, controlled study of adult patients admitted to the medical ICU, N=1200. On admission, patients were randomly assigned to intensive treatment or to conventional treatment. Intensive insulin therapy significantly reduced morbidity but not in-hospital mortality. Van den Berghe G et al. N Engl J Med. 2006;354:449-461.
Intensive Glucose Management in RCT *not significant
NICE-SUGAR All-cause mortality at 90 days: 27.5% for intensive group vs. 24.9% for conventional group (p = 0.02) All-cause mortality at 28 days: 22.3% vs. 20.8% (p = 0.17), respectively Severe hypoglycemia: 6.8% vs. 0.5% (p < 0.001), respectively Trial design: Patients admitted to the ICU were randomized to intensive glucose control (81-108 mg/dl; n = 3,054) vs. conventional glucose control (<180 mg/dl; n = 3,050). Insulin was given intravenously and nutrition was given enterally. Mean BG 115 mg vs 144 mg/dL. Results (p = 0.02) (p < 0.001) 27.5 24.9 % 6.8 Conclusions 0.5 • Among patients admitted to the ICU, intensive glucose control increased mortality an absolute 2.6% at 90 days (p = ns; CI 0.4 – 4.8) • Severe hypoglycemia was more common in the intensive control group All-cause mortality at 90 days Severe hypoglycemia Intensive glucose control Conventional glucose control NICE-SUGAR Investigators. N Engl J Med 2009;360:1283-97
NICE-SUGAR Study Outcomes The NICE-SUGAR Study Investigators. N Engl J Med. 360:1283-1297, 2009.
NICE-SUGAR: Strengths Large (N=6104) 2. Multicenter 3. Patients characteristic of a general ICU population 4. Uniformly applied, web-based IV insulin protocol 5. Hard primary endpoint (90-day mortality) 6. Robust analytical plan
NICE-SUGAR: Limitations Specified BG targets & ultimate BG separation (-27 mg/dl) not as distinct as prior trials 2. Treatment target not achieved in the intensive arm. 3. Variable methods/sources for BG measurement 4. More steroid therapy in intensive arm 5. More hypoglycemia in intensive arm (15-fold) 6. No explanation of increased mortality in intensive arm (? hypoglycemia) 7. ~ 10% early withdrawls in intensive arm; ‘per-procotol’ (‘completers’) analysis not provided.
Tight Glycemic Control in the Hospital • By normalizing glucose in the hospital, glucose toxicity is broken, improving both insulin secretion and insulin sensitivity • 382 Type 2 DM patients, aged 25–70 years, from nine hospital centers in China had their glucose normalized by MDI or CSII for 2 weeks • Remission rates after 1 year were significantly higher in the insulin groups (51% in CSII and 44% in MDI) than in the oral hypoglycaemic agents group (26%; p=0.0012) www.thelancet.com Vol 371 May 24, 2008
Intensive Insulin Therapy and Mortality Among Critically Ill Patients Favors IIT Favors Control Mixed ICU Medical ICU Surgical ICU ALL ICU Griesdale DE, et al. CMAJ. 2009;180(8):821-827.
Intensive Insulin Therapy and Hypoglycemic Events in Critically Ill Patients Hypoglycemic Events Favors IIT Favors Control 0.1 1 10 Reproduced with permission from Griesdale DE, et al. CMAJ. 2009;180(8):821-827. Risk Ratio (95% CI)
Is Hypoglycemia Life Threatening? Strategies for Preventing Hypoglycemia
Blood Glucose During Hospitalization and Incidence of Death Within 2 Years ≤3.0 mmol/L or 55 mg/dL n+44; 20 deaths 3.1-6.5 mmol/L or 56-119 mg/dL n=364; 101 deaths ≥6.6 mmol/L or ≥120 mg/dL n=276; 107 deaths 1.93 (1.18-3.17) Referent 1.48 (1.09-1.99) 3.5 2.5 1.5 .5 -.5 -1.5 -2.5 -3.5 Lowest blood glucose recorded during hospital stay Svensson AM et al. Eur Heart J. 2005 26:1255-1261.
Severe Hypoglycemia in Critically Ill Patients Associated With Increased Risk of Mortality 60 50 40 Mortality Rate, % 30 20 10 0 SH Controls No SH Severe hypoglycemia (<40 mg/dL) was associated with an increased risk of mortality (OR, 2.28; 95% CI, 1.41-3.70; P=.0008) Krinsley JS, Grover A. Crit Care Med. 2007;35(10):2262-2267.
Blood Glucose & Post-AMI OutcomesA U-Shaped Relationship? P < 0.001 for each endpoint Pinto DS, et al. J Am Coll Cardiol. 2005;46:178-180.
Mean Glucose & In-Hospital Mortality in 16,871 Patients with AMI (Reference: Mean BG 100-110 mg/dl) Kosiborod M et al. Circulation 2008:117:1018
Hypoglycemia and Cardiovascular Events • Tachycardia and high blood pressure • Myocardial ischemia • Silent ischemia, angina, infarction • Cardiac arrhythmias • Transiently prolonged corrected QT interval, • Increased QT dispersion • Sudden death Wright RJ, Frier BM, Diabetes Metab Res Rev 2008; 24: 353–363.
Strategies for Preventing Hypoglycemia in the ICU • Better protocols and systems to implement insulin protocols • Less aggressive BG targets (AACE/ADA Guidelines) • Improved glucose monitoring devices to analyzed frequent and accurate real-time CGM • Inpatient hyperglycemia teams
ICU setting: Starting threshold of no higher than 180 mg/dL Once IV insulin is started, the glucose level should be maintained between 140 and 180 mg/dL Lower glucose targets (110-140 mg/dL) may be appropriate in selected patients Targets <110 mg/dL or >180 mg/dL are not recommended AACE/ADA Recommended Target Glucose Levels in ICU Patients Not recommended <110 Acceptable 110-140 Recommended 140-180 Not recommended >180 Moghissi ES, et al; AACE/ADA Inpatient Glycemic Control Consensus Panel. Endocr Pract. 2009;15(4). http://www.aace.com/pub/pdf/guidelines/InpatientGlycemicControlConsensusStatement.pdf.
AACE/ADA Target Glucose Levels in Non–ICU Patients Non–ICU setting: Premeal glucose targets <140 mg/dL Random BG <180 mg/dL To avoid hypoglycemia, reassess insulin regimen if BG levels fall below 100 mg/dL Occasional patients may be maintained with a glucose range below and/or above these cut-points Hypoglycemia = BG <70 mg/dL Severe hypoglycemia = BG <40 mg/dL Moghissi ES, et al; AACE/ADA Inpatient Glycemic Control Consensus Panel. Endocr Pract. 2009;15(4). http://www.aace.com/pub/pdf/guidelines/InpatientGlycemicControlConsensusStatement.pdf
Methods For Managing Hospitalized Persons with Diabetes • Continuous Variable Rate IV Insulin Drip Surgery, NPO, Unstable, MI, DKA, Hyperglycemia, Steroids, Gastroparesis, Delivery, etc • Basal / Bolus Therapy (MDI) when eating
The Ideal IV Insulin Protocol • Easily ordered (signature only or preferably nurse mandated) • Effective (Gets to goal quickly) • Safe (Minimal risk of hypoglycemia) • Easily implemented • Able to be used hospital wide
Essentials of a good IV Insulin Algorithm • Easily implemented by nursing staff • Able to seek BG range via: - Hourly BG monitoring - Adjusts to the insulin sensitivity of the patient
Various Protocols Exist • Atlanta Multiplier Method • Van den Berghe (studied in critical care setting) • Portland Protocol (used in surgical setting) • Markovitz (studied in postoperative heart surgery patients) • Yale Protocol (studied in medical intensive care setting)
Practical Closed Loop Insulin Delivery: Multiplier Method A System for the Maintenance of Overnight Euglycemia and the Calculation of Basal Insulin Requirements in Insulin-Dependent Diabetics 1/slope = Multiplier = 0.02 6 5 4 Insulin Rate (U/hr) 3 2 1 0 0 100 200 300 400 Glucose (mg/dl) NEIL H. WHITE, M.D., DONALD SKOR, M.D., JULIO V. SANTIAGO, M.D.;Ann Int Med 1982 ;97:210-214
Continuous Variable Rate IV Insulin DripAtlanta Multiplier Method • Starting Rate Units / hour = (BG – 60) x 0.02 where BG is current Blood Glucose and 0.02 is the multiplier • Check glucose every hour and adjust drip • Adjust Multiplier to keep in desired glucose target range (90 to 120 in ICU; 100 to 140 on floor)
MultiplierPrinciples Insulin Units / Hour Glucose mg/ dl Davidson et al, Diabetes Care 28(10): 2418-2423, 2005
Ideal Solution • Computer directed insulin infusion • Complexity is moved to the computer • Standardization is achieved • Hypoglycemia is minimized Davidson et al, Diabetes Care 28(10): 2418-2423, 2005
Computer-Guided Vs. Standard Column-Based Insulin Regimens • Study Aim: To determine differences in glycemic control between treatment with a computer-guided algorithm (Glucommander) and a standard paper-form algorithm in critically ill patients in the ICU • Design:Multi-center, prospective, randomized trial in hyperglycemic patients admitted to a medical ICU • Primary outcome: Differences in BG control • Secondary outcomes: Number of hypoglycemic (BG <60 mg/dL and < 40 mg/dl) and hyperglycemic events (BG >200 mg/dL), ICU and hospital length of stay Newton CA et al. Diabetes 57 (Suppl. 1) 136A, 2008.
Glucommander vs. StandardMean Glucose Values Mean Glucose Maintained once Target Achieved Glucommander = 103.4 ± 9 mg/dL Standard = 120.4 ± 18 mg/dL * p < 0.0001 Newton CA et al. Diabetes 57 (Suppl. 1) 136A, 2008.
Glucommander vs. Standard % of Glucoses Maintained within Target Achieved Glucommander = 68.6% Standard = 46.4%* * p < 0.0001 Newton CA et al. Diabetes 57 (Suppl. 1) 136A, 2008.
% of PATIENTS with LOWEST BG < 40 mg/dL N BGmean All GlucommanderTM 1.1% G+TM G+TM SICU Other Tight-Control NICE-SUGAR GlucommanderTM
Strategies for Preventing Hypoglycemia Algorithm 1 Algorithm 2 Algorithm 3 Algorithm 4 BG BG BG BG (mg/dL) Units/hr Units/hr Units/hr Units/hr (mg/dL) (mg/dL) (mg/dL) <60 = Hypoglycemia (See below for treatment) <70 Off <70 Off <70 Off <70 Off 70 - 109 0.2 70 - 109 0.5 70 - 109 1 70 - 109 1.5 110 - 119 0.5 110 - 119 1 110 - 119 2 110 - 119 3 120 - 149 1 120 - 149 1.5 120 - 149 3 120 - 149 5 150 - 179 1.5 150 - 179 2 150 - 179 4 150 - 179 7 180 - 209 2 180 - 209 3 180 - 209 5 180 - 209 9 210 - 239 2 210 - 239 4 210 - 239 6 210 - 239 12 240 - 269 3 240 - 269 5 240 - 269 8 240 - 269 16 270 - 299 3 270 - 299 6 270 - 299 10 270 - 299 20 300 - 329 4 300 - 329 7 300 - 329 12 Reduce insulin rate or hold insulin infusion at a higher BG concentration 300-329 24 330 - 359 4 330 - 359 8 330 - 359 14 >330 28 >360 6 >360 12 >360 16 Newton CA et al. Diabetes 57 (Suppl. 1) 136A, 2008.
Events Triggering Hospital Hypoglycemia • Transportation off ward, causing meal delay • Failure to measure blood glucose before insulin doses • New NPO status • Interruption of • IV dextrose therapy • Total parenteral nutrition • Enteral feedings • Continuous venovenous hemodialysis Braithwaite SS, et al. Endocr Pract. 2004;10(suppl 2):89-99.
Features Increasing the Risk of Hypoglycemia in an Inpatient Setting • Advanced age • Renal failure • Liver disease • Concurrent illness (cerebral vascular accident, congestive heart failure, shock, sepsis) • Ventilator use • Concurrent medications (-blockers, quinolones, epinephrine) D’Hondt NJ. Diabetes Spectrum. 2008;21(4):255-261.
Benefits of a Nurse-Mandated Protocol • All patients are screened and treated the same way • Standardization can be achieved • Modification of the protocols can easilybe done based on outcomes and analysisof the data
Previously diagnosed DM Diabetic ketoacidosis or hyperglycemic crisis follow DKA protocol No previous diagnosis of DM and BG > 140 mg/dL Modification of therapy to keep BG at goal Begin BG testing BG is > 110 mg/dL for a critically ill patient; notify physician for initiation of IV insulin therapy BG is > 140 mg/dL for noncritically ill patient, notify physician for initiation of subcutaneous therapy Patient Presents With Hyperglycemia All patients with hyperglycemiashould have an HbA1C drawn to aid in transition and discharge therapy