Download
1 / 7
70 likes | 92 Views
Explore binomial distribution through soccer ball survey results from U.S. and Sweden households. Understand likely outcomes and probabilities.

E N D
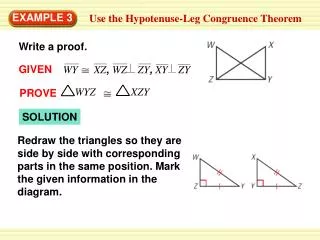
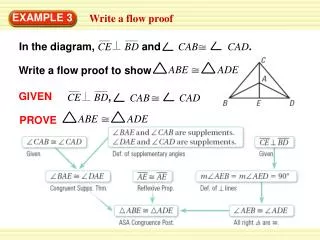
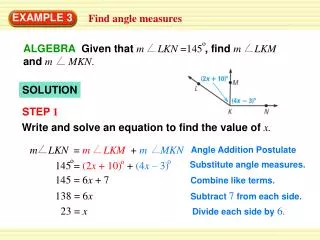
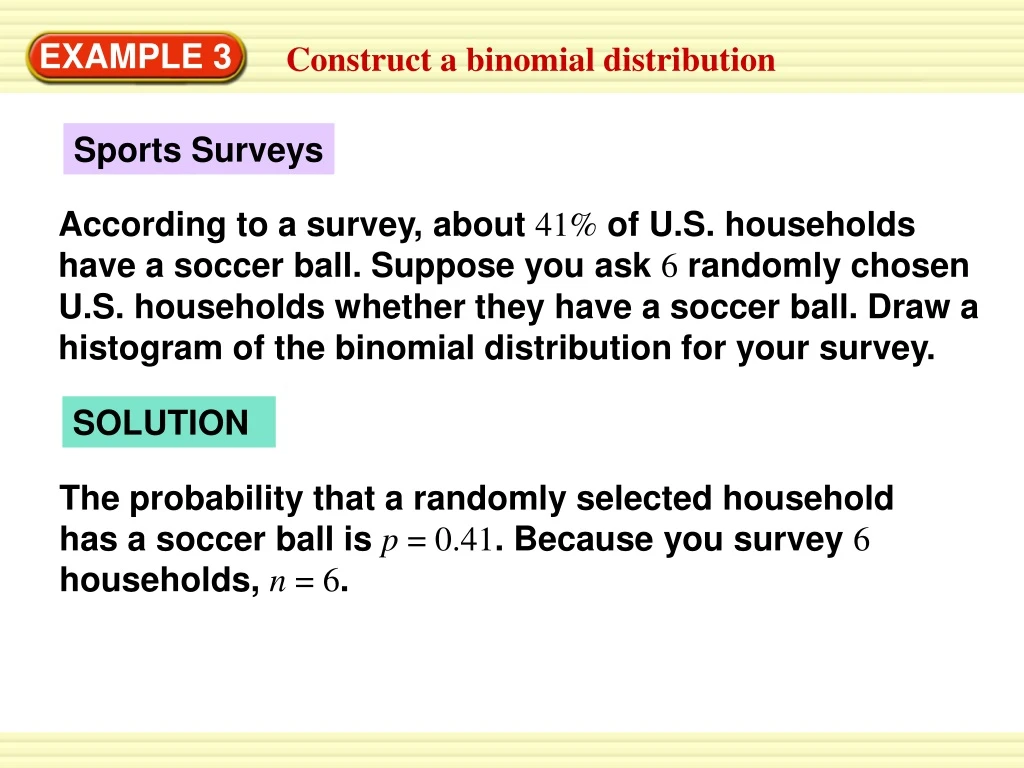
Sports Surveys According to a survey, about 41% of U.S. households have a soccer ball. Suppose you ask 6 randomly chosen U.S. households whether they have a soccer ball. Draw a histogram of the binomial distribution for your survey. EXAMPLE 3 Construct a binomial distribution SOLUTION The probability that a randomly selected household has a soccer ball is p = 0.41. Because you survey 6 households, n = 6.
P(k = 0) P(k = 5) = 6C0(0.41)0(0.59)6 = 6C5(0.41)5(0.59)1 0.042 0.041 P(k = 1) = 6C1(0.41)1(0.59)5 0.176 P(k = 6) = 6C6(0.41)6(0.59)0 0.005 P(k = 2) = 6C2(0.41)2(0.59)4 0.306 P(k = 3) = 6C3(0.41)3(0.59)3 0.283 P(k = 4) = 6C3(0.41)4(0.59)2 0.148 EXAMPLE 3 Construct a binomial distribution
A histogram of the distribution is shown. EXAMPLE 3 Construct a binomial distribution
What is the most likely outcome of the survey? What is the probability that at most 2 households have a soccer ball? The most likely outcome of the survey is the value of kfor which P(k) is greatest. This probability is greatest for k = 2. So, the most likely outcome is that 2 of the 6 households have a soccer ball. EXAMPLE 4 Interpret a binomial distribution Use the binomial distribution in Example 3 to answer each question. SOLUTION
The probability that at most 2 households have a soccer ball is: P(k <2) = P(k = 2) + P(k = 1) + P(k = 0) 0.306 + 0.176 + 0.042 0.524 So, the probability is about 52%. ANSWER EXAMPLE 4 Interpret a binomial distribution
Draw a histogram showing the binomial distribution for your survey. ANSWER for Examples 3 and 4 GUIDED PRACTICE In Sweden, 61% of households have a soccer ball. Suppose you ask 6 randomly chosen Swedish households whether they have a soccer ball.
P(k = 0) = 6C0(0.61)0(0.39)6 0.004 + P(k = 1) = 6C1(0.61)1(0.39)5 0.033 + 4. What is the most likely outcome of your survey? What is the probability that at most 2 households you survey have a soccer ball? P(k = 2) = 6C2(0.61)2(0.39)4 0.129 ANSWER 4 households; about 0.166 for Examples 3 and 4 GUIDED PRACTICE In Sweden, 61% of households have a soccer ball. Suppose you ask 6 randomly chosen Swedish households whether they have a soccer ball.