Download
1 / 1
10 likes | 115 Views
C++ Interface for Making Visualized Graphs By N.K. Bonsack and E.Harcourt. Abstract

E N D
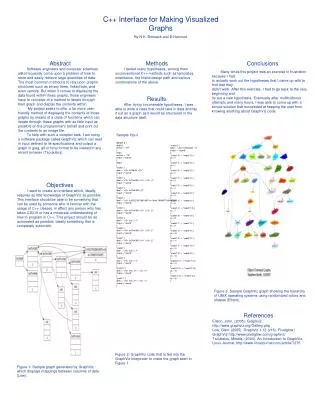
C++ Interface for Making Visualized Graphs By N.K. Bonsack and E.Harcourt Abstract Software engineers and computer scientists alike frequently come upon a problem of how to store and easily retrieve large quantities of data. The most common method is to rely upon graphic structures such as binary trees, linked lists, and even vectors. But when it comes to displaying the data found within these graphs, those engineers have to conceive of a method to iterate through their graph and display the contents within. My project seeks to offer a far more user-friendly method of displaying the contents of those graphs by means of a class of functions which can iterate through these graphs with as little input as possible on the programmer's behalf and print out the contents to an image file. To help with such a complex task, I am using a software package called GraphViz which can read in input defined to its specifications and output a graph in jpeg, gif or bmp format to be viewed in any recent browser (Tsoukalos). Methods I tested many hypotheses, among them unconventional C++ methods such as templates, inheritance, the friend design path and various combinations of the above. Conclusions Many times this project was an exercise in frustration because I had to actually work out the hypotheses that I came up with to find that they didn’t work. After this exercise, I had to go back to the very beginning and try out a new hypothesis. Eventually after multitudinous attempts and many hours, I was able to come up with a simple solution that succeeded at keeping the user from knowing anything about GraphViz code. Results After trying innumerable hypotheses, I was able to write a class that could take in data and lay it out as a graph as it would be structured in the data structure itself. Sample Input digraph g { graph [ rankdir = "LR" ]; node [ fontsize = "16" shape = "ellipse" ]; edge [ ]; "node0" [ label = "<f0> 0x10ba8| <f1>" shape = "record" ]; "node1" [ label = "<f0> 0xf7fc4380| <f1> | <f2> |-1" shape = "record" ]; "node2" [ label = "<f0> 0xf7fc44b8| | |2" shape = "record" ]; "node3" [ label = "<f0> 3.43322790286038071e-06|44.79998779296875|0" shape = "record" ]; "node4" [ label = "<f0> 0xf7fc4380| <f1> | <f2> |2" shape = "record" ]; "node5" [ label = "<f0> (nil)| | |-1" shape = "record" ]; "node6" [ label = "<f0> 0xf7fc4380| <f1> | <f2> |1" shape = "record" ]; "node7" [ label = "<f0> 0xf7fc4380| <f1> | <f2> |2" shape = "record" ]; "node8" [ label = "<f0> (nil)| | |-1" shape = "record" ]; "node9" [ label = "<f0> (nil)| | |-1" shape = "record" ]; "node10" [ label = "<f0> (nil)| <f1> | <f2> |-1" shape = "record" ]; "node11" [ label = "<f0> (nil)| <f1> | <f2> |-1" shape = "record" ]; "node12" [ label = "<f0> 0xf7fc43e0| | |1" shape = "record" ]; "node0":f0 -> "node1":f0 [ id = 0 ]; "node0":f1 -> "node2":f0 [ id = 1 ]; "node1":f0 -> "node3":f0 [ id = 2 ]; "node1":f1 -> "node4":f0 [ id = 3 ]; "node1":f2 -> "node5":f0 [ id = 4 ]; "node4":f0 -> "node3":f0 [ id = 5 ]; "node4":f1 -> "node6":f0 [ id = 6 ]; "node4":f2 -> "node10":f0 [ id = 7 ]; "node6":f0 -> "node3":f0 [ id = 8 ]; "node6":f1 -> "node7":f0 [ id = 9 ]; "node6":f2 -> "node9":f0 [ id = 10 ]; "node7":f0 -> "node3":f0 [ id = 11 ]; "node7":f1 -> "node1":f0 [ id = 12 ]; "node7":f2 -> "node8":f0 [ id = 13 ]; "node10":f1 -> "node11":f0 [ id = 14 ]; "node10":f2 -> "node12":f0 [ id = 15 ]; "node11":f2 -> "node1":f0 [ id = 16 ]; Objectives I want to create an interface which, ideally, requires as little knowledge of GraphViz as possible. This interface should be able to be something that can be used by someone who is familiar with the usage of C++ classes, in effect any person who has taken CS319 or has a moderate understanding of how to program in C++. This project should be as automated as possible, ideally something that is completely automatic. Figure 3: Sample GraphViz graph showing the hierarchy of UNIX operating systems using randomized colors and shapes (Ellson). References Ellson, John. (2005). Graphviz. http://www.graphviz.org/Gallery.php Low, Glen. (2005). Graphviz 1.13 (v16). Pixelglow | GraphViz http://www.pixelglow.com/graphviz/ Tsoukalos, Mihalis, (2004). An Introduction to GraphViz. Linux Journal. http://www.linuxjournal.com/article/7275 Figure 2: GraphViz code that is fed into the GraphViz interpreter to make the graph seen in Figure 1. Figure 1: Sample graph generated by GraphViz which displays mappings between columns of data (Low).