Download
1 / 23
230 likes | 324 Views
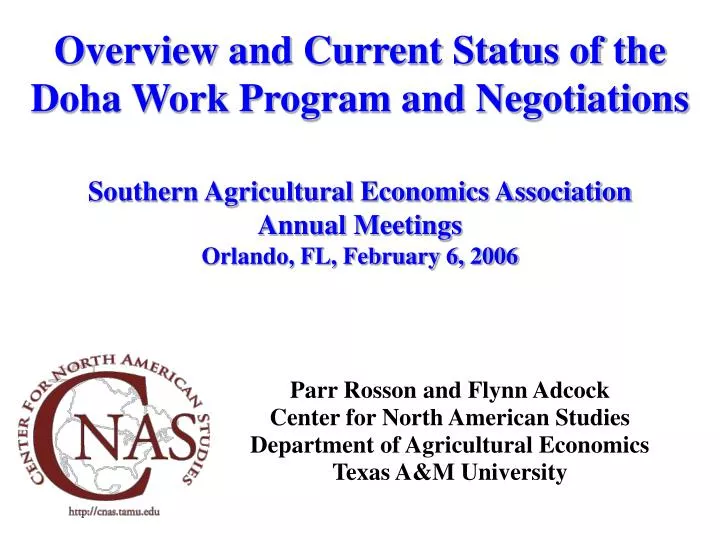
Overview and Current Status of the Doha Work Program and Negotiations Southern Agricultural Economics Association Annual Meetings Orlando, FL, February 6, 2006. Parr Rosson and Flynn Adcock Center for North American Studies Department of Agricultural Economics Texas A&M University. Overview.

E N D
Overview and Current Status of the Doha Work Program and NegotiationsSouthern Agricultural Economics AssociationAnnual MeetingsOrlando, FL, February 6, 2006 Parr Rosson and Flynn Adcock Center for North American Studies Department of Agricultural Economics Texas A&M University
Overview • International Setting • WTO Doha Agenda Progress • U.S. Trade Strategy • Conclusions & Implications
World Average Agricultural Tariffs, 2002 Percent 140 Region Average 115 World Average 120 85 100 62% 80 55 60 40 30 25 40 10 20 0 Asia United States South America North America European Union Central America Caribbean Islands Source: WTO & ERS/USDA
Agricultural Producer Support By Country 1986-88 and 2001-03 -Percent of Total Farm Receipts from Government- 1986-1988 80% 71% 2001-2003 65% 62% 60% 60% 40% 39% 33% 40% 26% 20% 20% 12% 20% 2% 0% New Zealand Canada United States EU Japan Korea Source: OECD's database (see www.oecd.org)
Doha Development Agenda in the World Trade OrganizationProgress to Date
Progress onDoha Development Agenda(2001-Present) • Work on Agriculture Began in 2000 Under Auspices of the WTO Agriculture Committee • Mandated by the Uruguay Round Agreement on Agriculture, 1994
Doha Work Program:Three Pillars of Trade Reform (August 1, 2004) • Market Access: Reductions in Tariffs • Export Competition: Elimination of Export Subsidies • Trade Distorting Domestic Support: Reductions Over Time
Market Access • Cut Highest Tariffs the Most • Designation of Some ‘Sensitive’ Sectors • Special & Differential Treatment for Developing & Less Developed Countries • U.S. Pushing for Deep Tariff Cuts by EU & Some Developing Countries (60-75%) • EU Reluctant to Cut Beyond 43%
Export Competition • Reduce & Eliminate Export Subsidies by Date Certain • EU Export Subsidies, $2+ Billion/Year • U.S. Export Credit Guarantees > 180 Days • $4.7 Billion/year in Recent Years • Eliminate Trade Distorting Practices of State Traders, such as Canadian Wheat Board • Subsidies, Govt. Financing, Increase Transparency • Food Aid that Displaces Commercial Sales to Be Eliminated
Trade Distorting Domestic Support • Year 1 Down Payment of 20% • Subsequent Phased Reductions • Caps on Amber & Blue Boxes • Reductions from Allowable Support • EU Even Announced Its Support • U.S. Cuts Likely to Approach 60% of Amber Box, to $7.64 Billion
Total Allowable Trade Distorting Domestic Support, 'The Big 3,‘ 2002 Billion Dollars $128 $140 Includes Amber + Blue Boxes, Product Specific + Non-product Specific De Minimis, Each Based on 5% of Total Value of Agricultural Production $120 $100 $80 $49 $48 $60 $40 $20 $0 European Union United States Japan WTO, Trade Policy Review and calculations.
Total Trade Distorting Domestic Support Remaining After Year 1 Down Payment (calculated) Billion Dollars $120.0 $100.2 $100.0 $80.0 $60.0 $39.2 $38.4 $40.0 $20.0 $0.0 European Union United States Japan
Total Trade Distorting Domestic Support Assuming 50 Percent Reduction Billion Dollars $60.0 $50.1 $50.0 $40.0 $30.0 $19.6 $19.2 $20.0 $10.0 $0.0 European Union United States Japan Calculated
Hong Kong, December 2005 • Little Progress Made in Hong Kong • EU Trade Commissioner said state of negotiations was “serious but not desperate.” • Agreement to Eliminate Export Subsidies by 2013 • Greater “Quota-Free, Duty-Free” Access Granted LDCs, Up to 97% of Products • LDC’s want it above 99% and Prepared to Veto • While Many Fundamental Issues Remain Unresolved, Deadlines Have Been Set
Hong Kong, December 2005(continued) • Agreement on Degree of Tariff Cuts by April 30, 2006 • EU Wants to Reduce by 39% (They Claim 46%) while U.S. and Others Think EU Needs to Reduce by about 60% • Each Country to Submit Tariff Schedules by July 30 • While Export Subsidies Addressed, More work on STE’s and Export Credit Guarantees Needed • Agreement Still Needed on Degree of Trade Distorting Domestic Support (Amber/Blue) • U.S. Wants about 53%, Pushing EU and Japan Towards 80% • This Does Not Address Green Box Programs • U.S. wants “New” Blue Box for CCPs
Other Negotiating/Related Issues • The Cotton Initiative, Begun by Benin, Burkina Faso, Chad and Mali, Claim Rich Country Subsidies Hurting Poor Countries • Compensation Requested, Issue in Negotiation • Cotton Case Won by Brazil Against U.S. Will Impact U.S. Cotton Program and Could Spur Challenges Against Other Crop Programs • U.S. Could Instead Decide Not to Comply, but Would face Brazilian Tariffs and Undermine Doha • Tight Timeline for U.S. because of Expiration of TPA in Mid-2007 and Low Prospects for Renewal • U.S. Budget Situation and Dissension within EU
U.S. Trade Strategy • Multilateral • World Trade Organization • China Now a Member-Currency, Textiles • Only Forum Where 148 Countries Are Present • Regional/Bilateral • CAFTA-DR • Unilateral • Generalized System of Preferences (GSP) • CBI/CBERA • African Growth Opportunities Act (AGOA)
Why Regional/Bilateral Agreements? • 2nd Best After MTN • WTO Has Been Slower than Desired • Outcome is Uncertain • Economic Incentives • Open Markets • Increase Business Efficiency • Keep Pressure on MTN to Perform
CUSTA, ‘89 Jordan ‘01 Bahrain ‘05 CAFTA-DR ‘05 NAFTA ‘94 Israel ‘85 Morocco ‘04 Thailand ‘05 Panama ‘06 MEFTA ‘06 Andean FTA ‘06 FTAA ‘06 Singapore ‘03 Chile ‘04 Southern African Customs Union ‘06 Australia ‘05 U.S. Trade Agreements
Conclusions & Implications • Agricultural Trade Distorted by Tariffs, Export Subsidies, Trade Distorting Domestic Support & Non-tariff Barriers • Deep Tariff Cuts by DCs/LDCs Will Allow More U.S. Exports, But TBN • But, What is the Trade-Off? • Some Reduction in U.S. Trade Distorting Domestic Support, Likely Substantial, TBN • Internal Budget Pressure Likely Affects Outcome
Conclusions & Implications • Absent WTO Progress, Trade & Economic Growth Stifled, Especially in Agriculture-Not Good for the South • Cotton Case Impacts and Potential for Similar Cases Must be Considered • Internal Political Realities Cause for Concern • Trade Reform is at a Crossroads: Protectionism or Progress? • If We Want to Open More Markets, Trade Agreements Are Needed
Thank You! Questions?