Download
1 / 28
721 likes | 2.06k Views
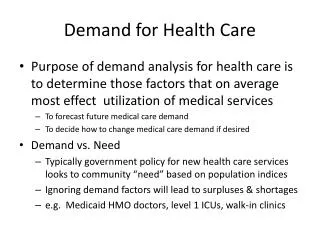
The Demand for health and healthcare - Grossman Model . Dr Emma Frew. Health Economics Unit Medical School. Learning objectives. How individuals allocate their resources to produce Health – role of age, wage and education Cost of Capital and Marginal Efficiency of Investment (MEI)

E N D
The Demand for health and healthcare - Grossman Model Dr Emma Frew Health Economics Unit Medical School
Learning objectives • How individuals allocate their resources to produce Health – role of age, wage and education • Cost of Capital and Marginal Efficiency of Investment (MEI) • Understand how the four-quadrant Grossman model works
Outline • MEI • Changes in equilibrium due to age, wage and education • Depiction of integrated Grossman model
Demand for Health Capital (1) • Individuals invest in themselves through education, training and health. The goal is to increase earnings • Two important concepts: Cost of Capital and MEI • Cost of Capital (C) C = Opportunity cost (cost of foregone alternatives i.e. interest rate) + rate at which capital good depreciates C = r + δ
Demand for Health Capital (2) • MEI – Rate of return vs amount of resources invested If rate of return on capital good is greater (less) than cost of capital, then the good will (not) be purchased. Capital good will be purchased only up to point where: Rate of return = Cost of Capital
Relationship of healthy days to Health stock 365 days Healthy Days HminHealth Stock
Production of Healthy Days • Health is a productive good which produces healthy days • Greater health stock leads to more healthy days – however with diminishing returns • Hmin is health stock minimum – production of healthy days at this point is zero i.e. death • Natural Maximum of 365 days
Optimal Health Stock Cost of MEI Capital r + δ0 A Health H0 Stock
MEI • If cost of capital is r + δ0 , then the optimal quantity of capital is H0, A represents the point of equilibrium • An x-ray machine that costs £50,000 and has 20 % rate of return (£10,000) will only be purchased if (r + δD) ≤ £10,000 • A 2nd machine will only be purchased if its rate of return ≥ (r + δD) • Diminishing Marginal Returns to investment - The rate of return of a 2nd machine would probably be less than the first, therefore MEI is downward sloping
Practical questions • What effect on optimal health stock or demand for health inputs do the following have: • Increases in life expectancy? • Getting a higher salary? • Going to college?
Changes in Equilibrium - Age • The rate at which health stock may depreciate may increase during some periods of life and decline during others. • As an individual ages the δ rate of health stock is likely to increase (from δ0 to δ1 and finally to δD) i.e. the health of older individuals is likely to deteriorate faster than the health of younger individuals. • Assume that wage and other factors determining MEI are not substantially altered by aging • Optimal health stock decreases with age (i.e. HO > H1)
Changes in Equilibrium - Age Cost of MEI Capital B r + δD r + δ1 r + δ0 A Health Hmin H1 H0 Stock
Changes in Equilibrium - Wage • Wage change will not affect cost of capital (r + δD is constant) • Increased wage rate will increase returns obtained from health days, hence a higher MEI curve i.e. 8 hrs @ £4/hr = £36 8 hrs @ £5/hr = £40 • If original MEI curve represents lower-wage case, then optimal health stock is HO . MEI2 shows MEI for someone with higher wages, with higher optimal health stock (H2) • Optimal health stock increases with level of wages (i.e. H2 > H0). Benefits of being healthy are greater for higher-wage workers
Changes in Equilibrium - Wage Cost of MEI Capital MEI2 C r + δ0 A Health H0 H2 Stock
Changes in Equilibrium – Education • Education improves efficiency in production • Higher education level raises marginal product of direct inputs i.e. less inputs are needed to produce a given amount of investment. A given investment can be generated at less cost for an educated person , hence higher rate of return to a given stock of health • Higher education level means a higher MEI curve (similar to effect of increased wage rate). • Optimal health stock increases with level of education (i.e. H2 > H0). A more educated person will choose a higher optimal stock of health than the less educated person.
Changes in Equilibrium – Education Cost of MEI Capital MEI2 C r + δ0 A Health H0 H2 Stock
The Integrated Grossman Model (1) In maximising utility subject both to time and money in a given period, a consumer must: • Allocate time between work and leisure • Spend remaining leisure time on health and nonhealth activities • Spend income earned on health (medical) and nonhealth (e.g. baking) resources • Produce health capital that may help in future years
The Integrated Grossman Model (2) Quadrant 1 • labour-leisure trade-off with respect to allocation of time to wage-earning activities • Budget constraint (BC-BC) indicates trade-off between labour and leisure (steeper line indicates higher wages) • Slope of indifference curve (U1) shows consumer’s subjective trade-off between leisure and earnings • Consumer’s optimal division between market work (TW) and leisure is equilibrium point A – Assuming no days are lost to illness (TL), he will work for (365-OT*) days and earn income G* [to be spent on medical inputs (for health production) and home good inputs]
The Integrated Grossman Model (3) Quadrant 2 • Trade-off between health investment (I) and home good (B) given consumer’s income and time • Consumer divides his time and money in producing I and B based on his preferences & his productivity • The Production Possibility Curve (PPC) shows all efficient combinations of I and B that can be produced when all of consumer’s income (G*) and time (OT*) are used to their full potential
The Integrated Grossman Model (4) Quadrant 4 • Shows production of either I or B based on his preferences • Width of ‘Edgeworth box’ is amount of time remaining after allocation of time between work and leisure and height is income that was earned • Contract curve – shows only combinations that are efficient for consumer to produce I or B • If he spends no time or money on health, he spends all of both on B and is at O; if he spends all his money (G*) and time (TH=nonwork time) on health, he is spending none on B and is at southeast corner of box
The Integrated Grossman Model (5) Quadrant 3 • Relates medical expenditure (M) to level of health investment (I) • If he spends TH time and M* amount of money on producing health, then I* level of health investment will be made • Note that he will spend (OT*- TH) on, and invest B* in, the home good • The higher M is, the higher I will be
Income (£) III BC Optimal levels ofLabour - Leisure Health InvestmentPPCG*Trade-off and the Home GoodA B*U1 Imax OTHT* BC Health Leisure Investment I* contract curve MedicalM* Expenditure Production of Health and Health and the Home Good Investment Imax III IV Medical expenditures (£)
Equilibrium in the Integrated Grossman Model • Consumer picks point A in QI, generating income of G* and has OT* leisure time. • From QII, consumer’s equilibrium is at A1, giving optimal investment in health of I* andin home good of B* • In QIV, TH and M* are spent on health care. • M* is translated through QIII to determine level of health in investment I*
Income (£) III BC Four-Quadrant PPCG*representation of A the Grossman model A1B*U1 Imax OTHT* BC Health Leisure Investment I* contract curve M* Imax III IV Medical expenditures (£)
Key messages from Grossman Model To maximise utility, a consumer must: • Allocate time between work and leisure • Spend remaining leisure time on health and nonhealth activities • Spend income earned on health and nonhealth resources • Produce or invest in health capital for future use
Summary • Optimal health stock will decline as the person ages if the depreciation rate of health increases as a person ages • Benefits of good health are greater for high wage workers so they demand higher optimal health stock • The more educated people are, the less costly it is to generate health resulting in a higher optimal health stock for this group • Individuals will allocate resources in order to produce health capital.
Conclusions • Grossman model has been influential in health economics. • Demand for health care inputs is demand derived from demand for health itself
References Grossman, M. (1972) On the concept of health capital and the demand for health, Journal of Political Economy 80: 223-255. Wagstaff, A. (1993), The demand for health: an empirical reformulation of the Grossman model, Health Economics 2: 89-198. McGuire, A., Henderson, J. & Mooney, G. (1988). The Economics of Health Care. London: Routledge and Kegan Paul Morris, S., Devlin, N. & Parkin, D. (2007) Economic analysis in health care. Chichester: John Wiley & Sons Grossman, M. (1982) The demand for health after a decade, Journal of Health Economics 1: 1-13 Folland, S., Goodman, A. & Stano, M. (2004). Economics of Health and Health Care. London: Prentice Hall