Download
1 / 37
370 likes | 528 Views
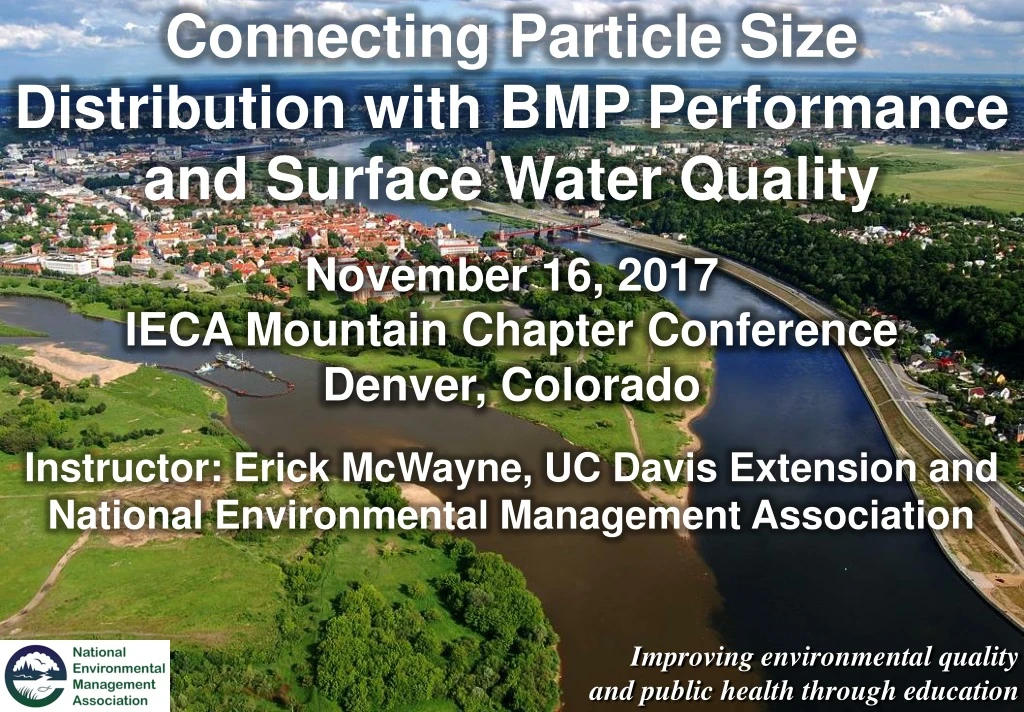
Connecting Particle Size Distribution with BMP Performance and Surface Water Quality. November 16, 2017 IECA Mountain Chapter Conference Denver, Colorado. Instructor: Erick McWayne, UC Davis Extension and National Environmental Management Association. Improving environmental quality

E N D
Connecting Particle Size Distribution with BMP Performance and Surface Water Quality November 16, 2017 IECA Mountain Chapter ConferenceDenver, Colorado Instructor: Erick McWayne, UC Davis Extension and National Environmental Management Association Improving environmental quality and public health through education
Speaker Info: Erick McWayne UC Davis Extension Instructor, andExecutive Director of the National Environmental Management AssociationOffice: (800)385-0783Cell: (206)419-9099 emcwayne@nemallc.comnemallc.com/
Particle Size Distribution (PSD) Analysis • Particle size distribution (PSD) is an important consideration in designing stormwater treatment practices for two reasons: • Particle size, density, and shape affect the settling velocity of particles. • The concentrations of sorbed metals and other contaminants are related to particle size. Source: Erickson et. al. (2010).
Nanoparticles Metals sorb to TDS nanoparticles effectively increasing the concentration of metals in solution. When water enters soil or streambed nanoparticles may get trapped via physiochemical processes (e.g., straining and sorbing). Metals sorb preferentially to particles ranging from 50 to 150 nm (mass fraction basis) in streambed sediment. Source: Hassellov, M. (2010). 4
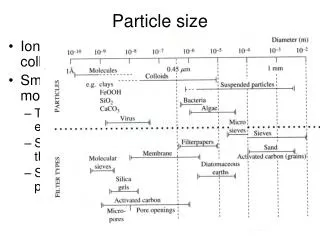
Particle Sizes • Particles less than 1 μm: • Have settling velocities less than 0.01 cm/s and likely remain in suspension; • Are the majority of particles by count in urban runoff (turbidity); • 50 to 60 μm is the practical limit for particle size removal by passive sedimentation systems (silt size). • Most particles trapped by BMPs are in the 100 to 2000 μm range (fine sand to course sand range). Source: Strecker (2014).
Total Suspended Solids • Total Suspended Solids (TSS): • Common surrogate or benchmark for BMP performance. • Fundamentally unreliable. • Includes sorbed heavy metals, hydrocarbons, and phosphorus that preferentially sorb to smaller particles (<250 microns). • BMPs designed to capture finer particles have a higher overall pollutant removal capability. 1 mm – 1,000 μm Source:Center for Watershed Protection (2008). 6
Managing Solids: TS. TDS, TSS, and SSC Total Solids (TS) – residue left in vessel after evaporation. Total Dissolved Solids (TDS) – portion of TS that will pass through a 2 micron filter (0.45 μm). EPA Method 160.1 Total Suspended Solids (TSS) – portion of TS that will not pass through a 2 micron filter (0.45 μm). EPA Method 160.2. Method uses subsamples that often don’t include the larger particles. *Suspended Sediment Concentration (SSC) – total sediment concentration within a sample container. Includes suspended solids and settleable solids (shaken prior to extraction – a.k.a. whole sample TSS). ASTM D-3977-97 method B 7
Total Suspended Solids (TSS) TSS – “Partial Sample Suspended Solids” typically collected by autosampler (wash load) SSC – “Total Sample Suspended Solids” Settleable Solids/Bedload – Not collected by autosampler – collected by bedload sampler 8
TSS versus SSC SSC data are more repeatable and more accurate than TSS. Source: USGS (2012)64 From 14,466 samples from 48 states and Puerto Rico 9
SSC – Suspended Sediment Concentration SSC – Measures All (Small and Large) Sediment Particles TSS – Measures Small Sediment Particles Source: USGS (2012)64 10
TSS Negative Bias Ramifications • The TSS method of analysis produces data that are negatively biased by 25 to 34% with respect to the SSC method and TSS data can result in errors in load computations of several orders of magnitude. • There is no reliable way to adjust TSS data to estimate suspended sediment without corresponding SSC data. Source: James (2002) 11
Facilitated Transport Pollutants can be dissolved, associated with dissolved organic matter, or attached to particulate matter (suspended or deposited). Sediment and pollutants sorbed to sediment typically comprise more that 50% of surface water pollutant loads. Contaminated sediment can be a source of long term exposure. Zn2+ 12
TSS Challenges • Although many pollutants are highly associated with particulates, the correlation between TSS and specific pollutants varies. • National Urban Runoff Program (NURP) data show that the coefficients of variation between TSS and metals range from 0.8 to 1.0 indicating that sorbed metal concentrations in urban runoff may vary by plus or minus two orders of magnitude at the same TSS concentration. Variation likely due to sampling error and differing PSD. Source: James (2002) 13
Sorption Bias Problem Source: Breault, R.F. (2003)22 Dissolved metals will come out of solution as a function of SSC concentrations. Example: Copper sorbs to suspended solids quickly and flow weighted composite samples (all samples) will yield erroneously low sample results if not immediately filtered. Even following EPA’s 15-minute holding time recommendation will yield significant low dissolved metal bias for high TDS samples. 14
PSD and Contaminants • In urban runoff, more than 50% of TSS mass is comprised of particles less than 20 μm for samples less than 100 mg/L TSS. • In general, the finest particles have the highest concentration of heavy metals, oil, and polycyclic-aromatic hydrocarbons (PAH) • Nutrients (TP and TN) are less bound to particles and are mostly adsorbed to sediment between 11 μm and 150 μm. • It is important to know whether sedimentation devices are capable of removing solids in these ranges (e.g., 11 μm to 150 μm for nutrient removal). Source: Boogaard et. al. (2015).
Metal Sorption vs. PSD Average concentration of adsorbed metals in stormwater (Sansalone and Buchberer 1997) (μm) Exception: Cadmium does not appear to preferentially sorb to smaller particles. Source: Erickson et. al. (2010).
PSD Correlation with Contaminants • Suspended Sediment Transports Contaminants: • Vaze and Chiew (2004) found that nearly all particulate TN (total nitrogen) and TP (total phosphorous) in stormwater was associated with particles between 11 and 150 microns. • Madge (2005) found that most bound TP and TN are contained in particle sizes of 5 to 20 microns and that removal of particles down to 5 microns would result in removal of 90% of TP and 37% of TN. Source: Center for Watershed Protection (2008) 17
PSD Correlation with Contaminants • Suspended Sediment Transports Contaminants: • Lau and Stenstrom (2005) found that the greatest mass of heavy metals and polynuclear aromatic hydrocarbons (PAHs) were associated with particles in the 100–250 micron range. • German and Svensson (2002) found that concentrations of heavy metals are inversely proportional particle diameter, and that a higher proportion of metals are found in particles of 125 microns or smaller. Source: Center for Watershed Protection (2008) 18
Particle Size Distribution - PSD Three terms for particle size – PSDm most common: PSDm – Particle size distribution by mass (e.g., 50% of the TSS mass is from particles less than 65 μm). Biased toward heavy particles. PSDn – Particle size distribution by number (e.g., 50% of the particles are less than 1 μm). Biased toward small particles. PSDv – Particle size distribution by volume (e.g., 50% of the TSS volume is from particles less than 65 μm). Biased toward larger particles. Rarely used and typically derived from PSDm. 19
PSDn versus PSDm PSDn shows most of the stormwater particles by count are very small, less than a few microns (μm). By PSDm most stormwater particles are less than 50 – 75 μm – there is a mass bias because larger particles are heavier Metals and organic pollutants are often disproportionately sorbed onto finer particles which are more difficult to treat via sedimentation. 20
Typical Stormwater PSD Australia Netherlands Uniform Silica BMP Testing SSC Source: Boogaard et. al. (2015). 1985-1986 data show smaller overall PSD
PSD Variations • PSD varies with location (spatially), with rainfall intensity (hydrologically), and with season and/or antecedent dry period (temporally). • Upstream treatment devices and conveyance systems also have an impact on the PSD. Source: Erickson et. al. (2010).
PSD Variations • PSD and settling velocity distribution is a primary consideration when a practitioner is selecting and designing a stormwater treatment practice. • Existing sedimentation practices designed for particles finer than the actual PSD are likely oversized and could potentially be replaced with smaller, cheaper, and more efficient systems. • Lower particle density and irregular shapes may increase settling velocity, requiring larger sedimentation practices. Source: Erickson et. al. (2010).
Wash Load & Bed Load • Wash load: • Particles < 40 μm are well mixed throughout the water column. • Particles > 62 μm form a gradient with larger particles at the base. • Bed load: • Particle size is a function of channel slope, specific gravity of the solids, particle shape, and flow velocity. Source: James (2002) 24
Sediment Trap Examples Norton Bottle Trap Hamlin Sediment Trap Automatic sampling for SSC/TSS has a bias toward smaller particles. Research has shown that the pickup velocity of automatic samplers range from 1 to 3 feet/second, which allows them to capture maximum particle sizes between 50 and 200 microns. Sediment traps installed within stormwater sewers can obtain more representative sediment samples.
Wash Load & Bedload • Automatic samplers do not sample the larger particles found in the bedload portion of the runoff flows. • Bedload samplers can be used to supplement automatic samplers in order to obtain more accurate PSDs in storm water and surface water. Source: James (2002) 26
PSD Analysis • Modified Suspended Sediment Concentration (SSC):ASTM Method D3977-97 (ASTM 2002) using wet sieve filtration (Method C) and glass fiber filtration (Method B). • Wet sieve filtration (Method C) passes the entire sample (minimum 1 L) through a 62.5 micron sieve (No. 230). • Glass fiber filtration (Method B) measures fines (silt/clay) by passing the wet sieve filtrate through a 1.5 micron glass fiber filter. • Sand fractions can also be measured: very fine to fine sand between 62.5 and 250 microns, and medium to coarse sand greater than 250 microns (No. 60 sieve). Source: “Technical Guidance Manual for Evaluating Emerging Stormwater Treatment Technologies,” WA State Dept. of Ecology (2011).
PSD Analysis Source: “Technical Guidance Manual for Evaluating Emerging Stormwater Treatment Technologies,” WA State Dept. of Ecology (2011).
PSD Analysis • Additional size fractions can be determined for evaluating effects of particle size on pollutant removal as follows: • Using two additional sieves (125 and 500 microns) in the wet sieve filtration to differentiate between very fine and fine sand (125 microns, No. 120 sieve) and between medium and coarse sand (500 microns, No. 35 sieve). • Analysis of the silt and clay fractions by laser diffraction to determine the percentages of coarse silt (62.5 - 31.25 microns), medium silt (31.25 - 15.6 microns), fine silt (15.6 - 7.8 microns), very fine silt (7.8 - 3.9 microns), and clay (<3.9 microns). These size categories are based on the Wentworth (1922) grade scale. Source: “Technical Guidance Manual for Evaluating Emerging Stormwater Treatment Technologies,” WA State Dept. of Ecology (2011).
Suspended Sediment vs. Bioavailability Source: California Department of Pesticide Regulations (2014) 30
Treatment Processes Based on Particle Size Source: Minnesota Pollution Control Agency (2015). 31
Sediment Particle Size Distribution Bias • Suspended Sediment Concentration (SSC or TSS): • Small particles (e.g., less than 10 μm) have low mass and don’t contribute much to SSC/TSS (mg/L). • Particle size distribution (PSD) removal standards that address small particle removal can help prevent implementation of low cost BMPs that don’t remove silt and clay. Source:Center for Watershed Protection (2008). I32
Sediment Reality versus Assumptions • Suspended sediment in runoff and surface water is often: • Asymmetrical rather than spherical (settles more slowly); • Organic rather than mineral-based (contaminants may migrate into porous particle interiors); and • Stormwater particles are not 2.65 g/cm3, the have densities ranging from 1.1 to 2.86 g/cm3 (settling more slowly than predicted). • Roadway runoff often has larger more dense particles than urban runoff (e.g., 90% > 117 μm, 50% > 555 μm, density ~ 3 g/cm3). • Roadway snowmelt PSD is often larger than roadway runoff (50% > 1,000 μm) from traction grit. Source: James (2002) 33
Questions? 34
References Boogaard, et. al. (2015). “Removal Efficiency of Stormwater Treatment Techniques: Standard Full Scale Laboratory Testing”. Urban Water Journal, October 2015. California Department of Pesticide Regulation (2014). “Environmental Fate of Pesticides – Part 1”. DPR Presentation. Center for Watershed Protection (2008). “BMP Performance Verification Tool Appendices”. Erickson et. al. (2010). “Stormwater Treatment: Assessment and Maintenance. The Importance of Particle Size Distribution on the Performance of Sedimentation Practices”. University of Minnesota, St. Anthony Falls Laboratory. Hassellov, M. (2010). “Engineered Nanoparticle Sizing and Concentration Measurement for Environmental Risk Assessment.” James, R.B. (2002). “TSS – A Viable Measure of Stormwater Pollutants?”. Water Resources Management, Technical Paper. Minnesota Pollution Control Agency (2015). “Minnesota Stormwater Manual”.
References Strecker, E. (2014). “Factoring Performance of BMPs into the Development of TMDLs for Lake Tahoe”. Washington State Department of Ecology (2011). “Technical Guidance Manual for Evaluating Emerging Stormwater Treatment Technologies”. Publication 11-10-061.