Download
1 / 5
50 likes | 147 Views
Tests of Significance for Regression & Correlation. b* will equal the population parameter of the slope rather than. because beta. has another meaning with respect to regression coefficients. b is normally distributed about b* with a standard error of.

E N D
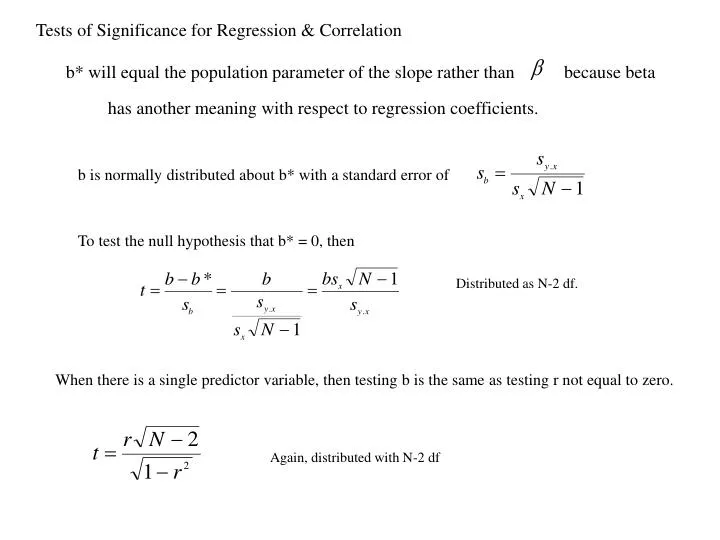
Tests of Significance for Regression & Correlation b* will equal the population parameter of the slope rather than because beta has another meaning with respect to regression coefficients. b is normally distributed about b* with a standard error of To test the null hypothesis that b* = 0, then Distributed as N-2 df. When there is a single predictor variable, then testing b is the same as testing r not equal to zero. Again, distributed with N-2 df
The difference between two independent slopes (like a t-test for two means) If the null hypothesis is true (b1* = b2*), then the sampling distribution of b1-b2 is normal with a mean of 0 and a standard error of… Thus, And is distributed with N1 + N2 –4 df Because we know… Therefore….
Transformed…. (is we assume homogeneity of error variance then we can pool the two estimates.) This can be substituted for the individual error variances in the above formula. Thus… Distributed with N1+N2 –4 df
The difference between independent correlations When is not equal to zero, the sampling distribution of r is NOT normal and its becomes more skewed more approaches 1.0 and the random error is not easily estimated. The same is the case for Fisher’s solution is that we transform r into r’ Then r’ is approximately normally distributed and the standard error is… Sometimes called the z transformation. As a z score, the critical value is 1.96
Test for difference between two related correlation coefficients Distributed with N-3 df. Note that to apply this test the correlation is required. Because the two correlations are not independent, we must take this into account (remember the issue with ANOVA). In this case, specially, we must incorporate a term that reflects the degree to which the two test themselves are related.