Download
1 / 40
400 likes | 416 Views
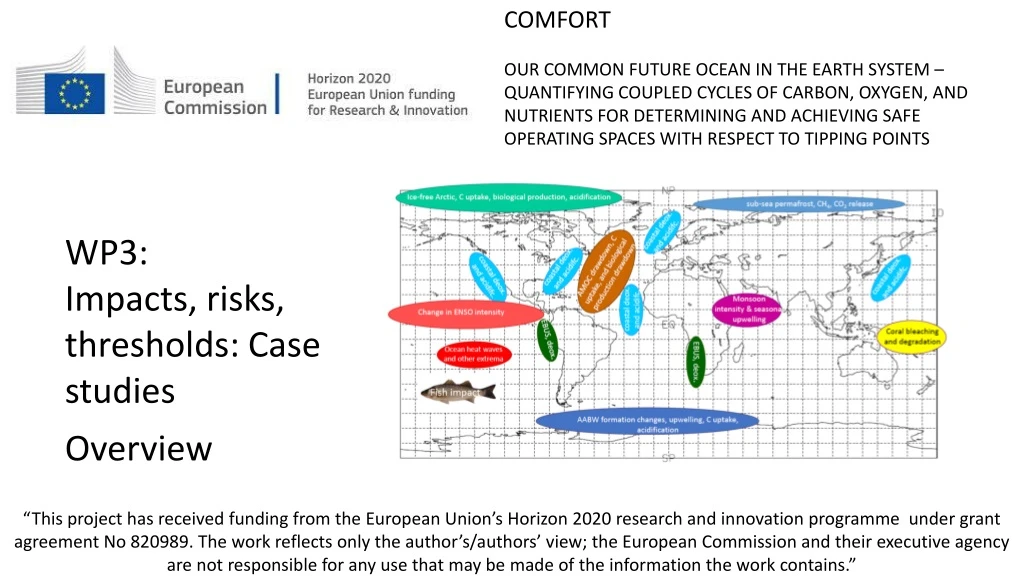
COMFORT OUR COMMON FUTURE OCEAN IN THE EARTH SYSTEM – QUANTIFYING COUPLED CYCLES OF CARBON, OXYGEN, AND NUTRIENTS FOR DETERMINING AND ACHIEVING SAFE OPERATING SPACES WITH RESPECT TO TIPPING POINTS. WP3: Impacts, risks, thresholds: Case studies Overview.

E N D
COMFORT OUR COMMON FUTURE OCEAN IN THE EARTH SYSTEM – QUANTIFYING COUPLED CYCLES OF CARBON, OXYGEN, AND NUTRIENTS FOR DETERMINING AND ACHIEVING SAFE OPERATING SPACES WITH RESPECT TO TIPPING POINTS WP3: Impacts, risks, thresholds: Case studies Overview “This project has received funding from the European Union’s Horizon 2020 research and innovation programme under grant agreement No 820989. The work reflects only the author’s/authors’ view; the European Commission and their executive agency are not responsible for any use that may be made of the information the work contains.”
COMFORT WP3: overview and outlook Task 3.1: Assessment of tipping points in habitats. CEA; NERSC; NORCE; NERCI D3.1 (M6=> Mar 2020; Resp. CEA): Report on initial analysis of critical thresholds and rates of changes in selected physical-chemical stressors (pH, O2, NPP, temperature, salinity, saturation state for calcite & aragonite) based on current knowledge. D3.2 (M24=> Sep 2021; Resp. NERSC): Report on past and future tipping points in habitats (surface ocean, mesopelagic, and deep habitats) Task 3.2: Assessment of tipping points in ecosystems. CLS; PML D3.3 (M36=>Sep 2022; Resp. CLS): Report on past and future tipping points in ecosystem components (low- to mid-trophic carbon flow and end-to-end tipping points up to highest trophic level) Task 3.3 Assessment of tipping points in fisheries. IIASA; IIASA; CLS; NERCI D3.4 (M36=>Sep 2022; Resp. IIASA): Report on past and future vulnerabilities of selected fish stocks (Arctic stocks, tuna stocks, Indian-coast stocks) to tipping points All contribute to D4.3 (M24=> Sep 2021; Resp. SU (Thorsten.Blenckner@su.se): Assessment of impacts of tipping points and their safe operating spaces using the results from the case studies.
COMFORT WP3: overview and outlook Task 3.1: Assessment of tipping points in habitats. CEA; NERSC; NORCE; NERCI D3.1 (M6=> Mar 2020; Resp. CEA): Report on initial analysis of critical thresholds and rates of changes in selected physical-chemical stressors (pH, O2, NPP, temperature, salinity, saturation state for calcite & aragonite) based on current knowledge. D3.1 March 2020 “As an initial step, a preliminary list of thresholds and critical rates of change will be made available at M6 based on literature screening, which will subsequently be updated based on time-series analyses (observations, model output, and published paleo-evidence).” • Contribution: • CEA = Literature Review and updated analysis Is thereanyother contribution expected (NERSC, NORCE, NORCI) ?
COMFORT WP3: overview and outlook Task 3.1: Assessment of tipping points in habitats. CEA; NERSC; NORCE; NERCI D3.2 (M24=> Sep 2021; Resp. NERSC): Report on past and future tipping points in habitats (surface ocean, mesopelagic, and deep habitats) D3.2 September 2021 “Tipping points in ocean habitats will be investigated through three coordinated analyses covering the full water column… and in addition … one study on coral bleaching ” Concept: Large shifts (tipping points) in the marine biogeochemical balance are detectable via migration and emergence of biogeographical provinces triggered by physical environment (climate) change. NORESM model simulations to detect areas in the Arctic which are likely to experience tipping points (focus: rapid change in sea-ice conditions) (NERSC) Tipping points of mesopelagic biomass provinces (NORCE) Changes in habitat conditions of deep-sea ecosystems (CEA) Effects of increasing SST on coral bleaching (NERCI) Tipping points? uncertainties of BPs from multi-model ensembles (ESMs) and biases from observation. Biographical provinces in the Arctic Ocean defined by physical environment (Pabi et al., 2008) Beyond Longhurst (1995): Biographical provinces after EnKF + cluster analysis (Simon et al. 2015).
COMFORT WP3: overview and outlook Task 3.1: Assessment of tipping points in habitats. CEA; NERSC; NORCE; NERCI D3.2 (M24=> Sep 2021; Resp. NERSC): Report on past and future tipping points in habitats (surface ocean, mesopelagic, and deep habitats) D3.2 September 2021 “Tipping points in ocean habitats will be investigated through three coordinated analyses covering the full water column… and in addition … one study on coral bleaching ” A proxy of mesopelagic biomass is provided by a linear model between acoustic 38KHz data and surface primary productivity (PP), temperature at the depth of DSL (TPDSL) and wind stress (𝜏) NORESM model simulations to detect areas in the Arctic which are likely to experience tipping points (focus: rapid change in sea-ice conditions) (NERSC) Tipping points of mesopelagic biomass provinces (NORCE) Changes in habitat conditions of deep-sea ecosystems (CEA) Effects of increasing SST on coral bleaching (NERCI) DSL depth: ZPDSL = 483.8 + 1272 × 𝜏 + 143 × PP Mean Volume Backscattering Strength (Proud et al., 2017) Outputs of CMIP5/6-models used to identify tipping points* in mesopelagic biomass and their drivers. *future biomass is below specified thresholds for biomass shallowing of the DSL-depth
COMFORT WP3: overview and outlook Task 3.1: Assessment of tipping points in habitats. CEA; NERSC; NORCE; NERCI D3.2 (M24=> Sep 2021; Resp. NERSC): Report on past and future tipping points in habitats (surface ocean, mesopelagic, and deep habitats) D3.2 September 2021 “Tipping points in ocean habitats will be investigated through three coordinated analyses covering the full water column… and in addition … one study on coral bleaching ” Large projecteddecline in deepfaunalbiomass (Jones et al 2014; Gehlen et al 2014) in relation th change in POC and pH Projected change in pH (7 ESMs) betweenpre-industrial and end of 21st century. Gehlen et al. (2014) NORESM model simulations to detect areas in the Arctic which are likely to experience tipping points (focus: rapid change in sea-ice conditions) (NERSC) Tipping points of mesopelagic biomass provinces (NORCE) Changes in habitat conditions of deep-sea ecosystems (CEA) Effects of increasing SST on coral bleaching (NERCI) deepsea canyon CMIP6 model outputs seamounts Species distribution models (connectivity /currents) Range shifts Extinctions recomposition
COMFORT WP3: overview and outlook Task 3.1: Assessment of tipping points in habitats. CEA; NERSC; NORCE; NERCI D3.2 (M24=> Sep 2021; Resp. NERSC): Report on past and future tipping points in habitats (surface ocean, mesopelagic, and deep habitats) D3.2 September 2021 “Tipping points in ocean habitats will be investigated through three coordinated analyses covering the full water column… and in addition … one study on coral bleaching ” Impact of SST long term trend on coral bleaching events • Analysis of bleaching events (Lakshadweep Is) against Satellite and in situ SST over last 3 decades • SST decadal trend, indicator (Degree Heating Weeks & Maximum Monthly Mean coral bleaching) => thresholds. Influence of extreme events like ENSO and IOD. NORESM model simulations to detect areas in the Arctic which are likely to experience tipping points (focus: rapid change in sea-ice conditions) (NERSC) Tipping points of mesopelagic biomass provinces (NORCE) Changes in habitat conditions of deep-sea ecosystems (CEA) Effects of increasing SST on coral bleaching (NERCI) • Response of coral colonies to increasing SST and post-bleaching health status • Pilot surveys for monitoring • Monitoring (Scuba diving/ in summer) of bleaching and paling events • Statistical modelling : depth and species specific response of coral reefs to increasing temperature • Post bleaching surveys (+6 mo) to identify the recovery trend => climate resilient reef areas (MPA). • How to develop a robust regional coral bleaching threshold? • Improving Indicators (DHW & MMM) by including regional factors (SST, PAR, low-tide exposure, UV) & discriminating dominant coral forms. • Rate of change in calcification at different locations: Net ecosystem calcification (McMahon et al., 2018) based on pH, total alkalinity, T & S. • Statistical model of geospatial coral bleaching hot-spot
COMFORT WP3: overview and outlook Task 3.2: Assessment of tipping points in ecosystems. CLS; PML D3.3 (M36=>Sep 2022; Resp. CLS): Report on past and future tipping points in ecosystem components (low- to mid-trophic carbon flow and end-to-end tipping points up to highest trophic level) D3.3 September 2022 “Tipping points in ocean ecosystems will be investigated through two coordinated analyses covering the full range of trophic levels. ” (Lehodey et al 2010; 2015) A global model of zooplankton and micronekton functional groups (SEAPODYM) coupled to physical and BGC model projections to identify trends and potential thresholds due to abrupt changes or combination of multiple stressors (including temperature, productivity, and deep circulation). (CLS) A regional Size spectrum (MIZER) ecosystem model for th NW European shelf Seas coupled to physical-biogeochemical model outputs under SSP and abrupt climatic-events scenarios. (PML) PP, T°, U, V Time of development (tm) vs water temperature 1 zooplankton & 6 micronekton functional groups, according to their vertical behavior. Product of COPERNICUS MEMS catalogue since July 2019. 1st reanalysis (1998-2018; ¼°)
COMFORT WP3: overview and outlook Task 3.2: Assessment of tipping points in ecosystems. CLS; PML D3.3 (M36=>Sep 2022; Resp. CLS): Report on past and future tipping points in ecosystem components (low- to mid-trophic carbon flow and end-to-end tipping points up to highest trophic level) ERSEM: plankton et al. D3.3 September 2022 MIZER: fish community • body mass: 1 mg – 1000 kg • 100 log-spaced size classes • depth-integrated biomasses • online coupled through FABM “Tipping points in ocean ecosystems will be investigated through two coordinated analyses covering the full range of trophic levels. ” A global model of zooplankton and micronekton functional groups (SEAPODYM) coupled to physical and BGC model projections to identify trends and potential thresholds due to abrupt changes or combination of multiple stressors (including temperature, productivity, and deep circulation). (CLS) A regional Size spectrum ecosystem model (MIZER) for the NW European shelf Seas coupled online to physical-biogeochemical model outputs under SSP and abrupt climatic-events scenarios. (PML) Blanchard et al. 2009. J Animal Ecol 78: 270–280 Blanchard et al. 2014. J ApplEcol 214: 612-622 prey 4 x phytopk 3 x zoopk oxygen waste CO2, ammonia, phosphate • Complete model chain from photons to fisheries • Two-way coupling => better top closure for plankton, better prey fields for fish? • Climate Changes in size spectra up to highest trophic levels as a consequence of abrupt climate change and potential for tipping point induced by trophic cascade
COMFORT WP3: overview and outlook Task 3.3 Assessment of tipping points in fisheries. Lead: IIASA; D3.4 (Mar 2024) D3.4 (M36=>Sep 2022; Resp. IIASA): Report on past and future vulnerabilities of selected fish stocks (Arctic stocks, tuna stocks, Indian-coast stocks) to tipping points D3.4 September 2022 “Tipping points in ocean fisheries will be investigated through three coordinated analyses covering important fish stocks worldwide.” Quantitative modelling framework for bio-energetically driven nonlinear life-history dynamics of key Arctic stocks and fisheries (Atlantic cod, capelin, herring, and Alaska Pollock). (IIASA) Spatial Ecosystem And Population dynamics Model (SEAPODYM) for the four species dominating world tuna fisheries (skipjack, yellowfin, bigeye, and albacore) (CLS) Impact of expanding oxygen minimum zone in the central Arabian Sea on primary productivity and fisheries of the west coast of India (NERCI) The model will be calibrated for key Arctic stocks and fisheries allowing: - to balance fisheries benefitsacross multiple benefit indicatorsand multiple stakeholders - to identify managementregimes that safeguard againsttipping points while providinghigh joint stakeholdersatisfaction under current andfuture conditions
COMFORT WP3: overview and outlook Task 3.3 Assessment of tipping points in fisheries. Lead: IIASA; D3.4 (Mar 2024) D3.4 (M36=>Sep 2022; Resp. IIASA): Report on past and future vulnerabilities of selected fish stocks (Arctic stocks, tuna stocks, Indian-coast stocks) to tipping points D3.4 September 2022 “Tipping points in ocean fisheries will be investigated through three coordinated analyses covering important fish stocks worldwide.” Quantitative modelling framework for bio-energetically driven nonlinear life-history dynamics of key Arctic stocks and fisheries (Atlantic cod, capelin, herring, and Alaska Pollock). (IIASA) Spatial Ecosystem And Population dynamics Model (SEAPODYM) for the four species dominating world tuna fisheries (skipjack, yellowfin, bigeye, and albacore) (CLS) Impact of expanding oxygen minimum zone in the central Arabian Sea on primary productivity and fisheries of the west coast of India (NERCI) www.seapodym.eu • The model is driven by temperature, currents, primary production and dissolved oxygen, zooplankton and micronekton • Model parameters are estimated using historical catch data (and tagging) using adjoint technique and Maximum Likelihood Estimation Approach
COMFORT WP3: overview and outlook Task 3.3 Assessment of tipping points in fisheries. Lead: IIASA; D3.4 (Mar 2024) D3.4 (M36=>Sep 2022; Resp. IIASA): Report on past and future vulnerabilities of selected fish stocks (Arctic stocks, tuna stocks, Indian-coast stocks) to tipping points D3.4 September 2022 “Tipping points in ocean fisheries will be investigated through three coordinated analyses covering important fish stocks worldwide.” Which bio and physical variables influence the OMZ distribution in Arabian Sea and Bay of Bengal? Building up a regional database for oxygen minimum zones (OMZ) Mapping spatio-temporal variability of OMZ OMZ climatology to identify recent anomalies. Modeling OMZ using a biogeochemical model and comparison at the study site. Quantitative modelling framework for bio-energetically driven nonlinear life-history dynamics of key Arctic stocks and fisheries (Atlantic cod, capelin, herring, and Alaska Pollock). (IIASA) Spatial Ecosystem And Population dynamics Model (SEAPODYM) for the four species dominating world tuna fisheries (skipjack, yellowfin, bigeye, and albacore) (CLS) Impact of expanding oxygen minimum zone in the central Arabian Sea on primary productivity and fisheries of the west coast of India (NERCI) What are the implications of expanding OMZ on regional fishery resources? Case study = Pelagic fishery of the west coast of India (catch data from Central marine Fisheries Institute (CMFRI)) Statistical analysis of decadal variability in catch/CPUE against OMZ and physical drivers to define fish specific hypoxic tipping point. Study of fish community shifts & evidences of alternative stable states to identify reversible and irreversible CC impacts. What are the changes in primary productivity and producers in response to CC and expanding OMZ? Climatology and anomalies of PP along the west coast of India Statistical models and geo-spatial tools to identify drivers of PP anomalies Study of the impact of expanding OMZ on the alterations in PP.
COMFORT OUR COMMON FUTURE OCEAN IN THE EARTH SYSTEM – QUANTIFYING COUPLED CYCLES OF CARBON, OXYGEN, AND NUTRIENTS FOR DETERMINING AND ACHIEVING SAFE OPERATING SPACES WITH RESPECT TO TIPPING POINTS Observation and modelling of ecosystem and fisheries Biases in Earth Climate models …. … and approaches to correct them before running ecosystem models 3) Quantitative modelling framework for bio-energetically driven nonlinear life-history dynamics of key Arctic stocks and fisheries WP3: Impacts, risks, thresholds: Case studies Initial work
1) The lower and mid-trophiclevels2) the highertrophiclevels and fisheries Observing and modeling the oceanEcosystem • Blue economy: • Aquaculture fishmeal; “Omega-3” oils (krill) • Ecosystemic services: • Prey of exploited stocks and protectedspecies • Climate Change (CO2 sequestration) Mesocosms Zooplankton global database: www.st.nmfs.noaa.gov/copepod/ Global biomass estimate between of mesopelagic fish between 1 and 10 billion tons. No estimate for squids, deep shrimps, gelatinous organisms… Crédit: R.Kloser J. Young CSIRO ! Link with H2020 MEESO (juststarting)
1) The lower and mid-trophiclevels2) the highertrophiclevels and fisheries Observing and modeling the ocean Ecosystem Eco-trophicmodellingapproach eg., Atlantis Calibration of Diet matrix eg., ECOPATH/ECOSIM Murphy et al (2012) Cox et al (2002)
1) The lower and mid-trophiclevels2) the highertrophiclevels and fisheries Observing and modeling the oceanEcosystem Size-basedmodellingapproach J. L. Blanchard et al (2017): FromBacteria to Whales: UsingFunctional Size Spectra to Model Marine Ecosystems. Trends in Ecology & Evolution (32/3) Size-spectra for four marine ecosystems: a. Georges Bank, b. North Sea, c. Browns Bank, and d. Pacific gyre. Slopes are comparable but differences in intercept reflect differences in primary production. Sheldon et al (1977); Boudreau and Dickie (1992); Jennings et al (2008) PP osmose Slope = mizer apecosm Constant energytransferefficiencythrough size spectrum (slope) Seapodym (lmtl & fish) Time continuum Discretefunctional groups (time of development) Distribution of teleost biomass (gWW). Jennings et al (2008) Global-scale predictions of community and ecosystem properties from simple ecological theory. Proc. R. Soc. B, 275, 1375–1383
1) The lower and mid-trophiclevels2) the highertrophiclevels and fisheries Observing and modeling the oceanEcosystem Time of developmentuntilmaturity vs temperature mesozooplankton SEAPODYM-LMTL SEAPODYM-LMTL simulates biomass distributions of 1 zooplankton and 6 micronekton functional groups, according to their diel vertical migration behavior. Their spatio-temporal dynamics are driven by temperature and oceanic currents. micronekton Zoo & micronekton Prod & biomass Primary production A parsimonious approach (11 param.) A robust Maximum likelihood Estimation approach (Lehodey et al 2015) Temperature; currents
1) The lower and mid-trophiclevels2) the highertrophiclevels and fisheries Observing and modeling the ocean Ecosystem Model Validation • 1) Acoustic • Someorganisms are stronglyresonant, eg siphonophores (Proud et al 2018) • Someothers are not at all (eg squids, large mesopelagicfishwithswimbladdersinvaded by fat (Dornan et al. 2019) Conclusions of the MESOPP project (www.mesopp.eu) • To use (assimilate) acoustic data to estimate model parametersthat control the production and biomass acoustic observation modelsneed to bedeveloped to convert model biomassinto acoustic signal • acoustic observation modelsshouldbeapplied by regionknowing for eachregion the average composition of species and their acoustic characteristics • Biomassestimatesfromtrawl sampling are stillveryuseful and can beusedafter standardisation (ongoing)
Observing and modeling the oceanEcosystem 1) The lower and mid-trophiclevels2) the highertrophiclevels and fisheries stock “recruitment” • Task 3.2b 2-way coupling BGCM - size-spectrum ( NW European Seas) PML (Jorn) Much more dynamic than traditional top closure! Potential for qualitatively different dynamics zooplankton mortality validation: observed vs. modelled size spectrum NEMO-ERSEM-mizer, AMM7 domain @ 7 km, 50 years of offline spin-up, 3 years of two-way coupled simulation => 1 reanalysis of zoo and micronekton (SEAPODYM-LMTL) in preparation at 1/12° (9 km). Strong interest for intercomparison! Celtic Sea
Observing and modeling the oceanEcosystem 1) The lower and mid-trophiclevels2) The highertrophiclevels and fisheries SEAPODYM-Tuna - Model parameters are estimated using historical catch data using adjoint technique and Maximum Likelihood Estimation Approach and based on historical hindcast/reanalyses (eg coupled OBGCM model driven by INTERIM) • Optimal fit between model catch predictions and observed catch by multiple fisheries • Realisticenvironmentalvariability (ENSO) • Impact of fishing (management) Most recentachievement: Tagging data added to the MLE allowing to improve the estimate of movement and habitat parameters Senina I., Lehodey P., Sibert J., Hampton J., (in press) Improving predictions of a spatially explicit fish population dynamics model using tagging data. Canadian Journal of Aquatic and Fisheries Sciences. 2011: La Niña 2015 : El Niño Predicted exploitable skipjackdensity (t/km2) at resolution ¼° x week (2013-2015) and observed total catch (monthly) With Catch With Catch & tags No fishing fishing
Observing and modeling the oceanEcosystem 1) The lower and mid-trophiclevels2) The highertrophiclevels and fisheries Once the parametrisationisachieved and validated, projections of climate change can beexploredusingClimate model outputs. BUT! BiasesfromEarthClimatemodels forcings: Skipjacktunabiomass 1st approach: Correction is made on atmospheric forcings (5 models) before running coupled OBGCM to get consistent bio-physical variables Monthlybiomass of mature albacore (t / km2) and observed catch % to circles) 2005 The spatial dynamics of Albacore has been modelled and estimated quantitatively in the South Pacific and Atlantic: Senina et al. (In press) Quantitative modelling of the spatial dynamics of south Pacific And Atlantic Albacore tuna Populations. Deep Sea Res. CLIOTOP special issue. 2050 2100
Reconciling Societal Objectivesand Stakeholder Interests in Integrated Fisheries Assessments Ulf Dieckmann Evolution and Ecology Program International Institute for Applied Systems Analysis Laxenburg, Austria Collaborators Mikko Heino, Dorothy Dankel, Mia Eikeset,Andries Richter, Erin Dunlop, Nils Christian Stenseth
Fishery Systems Management system Management measures Service values Fishery policy and planning Fishery management Fishery development Fishery research Socio-economic system Ecosystem services Fishers Supporting services Processors and retailers Regulating services Consumers Provisioning services Socio-economic environment Cultural services Natural system Target stock Non-target species Fishing pressure Ecosystem status Ecosystem embedding Physical environment
Integrative Quantitative Assessments • Societies have diverse interests in the ecosystem services rendered by fisheries • Within societies, stakeholder groups differ in their preferences, often strongly • Quantitative assessments of biological stock dynamics have been well developed for decades • In contrast, accounting for non-biological objectives is often left to political processes without being backed up by quantitative assessments • Integrative quantitative assessments are needed
Alternative Societal Objectives 1 Example
Integrated Quantitative Assessment Ca. 460,000 tonnes Northeast Arctic cod
Derived Harvest Control Rules Harvest-control rules are politically negotiated without support from quantitative modeling Our assessment is process-based, couples an individual-based biological model with an economic model, and accounts for three alternative objectives Current rule maximizes profit, while alternative objectives lead to more aggressive exploitation Yield-maximizing HCR(Johannesburg WorldSummit 2002) Welfare-maximizing HCR Current HCR Profit-maximizing HCR Adult biomass (1000 tonnes)
2 Example Competing Stakeholder Objectives
Hilborn 2007: “Zone of New Consensus” Profit Yield Employment Zone of traditional fisheries management Zone of new consensus Benefits (utility) Ecosystem preservation Fishing effort 0 Population crash
Integrated Quantitative Assessment 1. Biological model Northeast Arctic cod, Barents Sea capelin 2. Socio-economic model Fleet costs, revenues, and effort-employment relationships estimated from profitability surveys by the Norwegian Fisheries Directorate 3. Stakeholder model Pluralistic preferences
Mapping the Zone of Consensus Stakeholder A Stakeholder B Area of high joint stakeholder satisfaction: Consensus most likely
Summary • New methods help integrate non-biological objectives into quantitative assessments of fisheries systems This reveals surprises: • Regarding societal objectives, profit maximization is not maximally aggressive, and yield maximization is not minimally aggressive • Regarding stakeholder objectives, reconciliation is more realistic than portrayed by polarized debates, and focusing on quotas alone is misleading