Download
1 / 7
80 likes | 429 Views
The Planned Liquefied Natural Gas (LNG) Liquefaction Capacity will Account for 42% of Global LNG Liquefaction by 2016

E N D
Planned LNG Terminals Market - Global Analysis,Competitive Landscape and Capacity Forecasts to 2016
The Planned Liquefied Natural Gas (LNG) Liquefaction Capacity will Account for 42% of Global LNG Liquefaction by 2016 An increasing number of offshore gas discoveries, the development of unconventional gas Source and advances in offshore liquefaction technology will drive the growth of planned LNG liquefaction terminals during 2011–2016. A buoyant global demand for gas will further expedite the development of planned LNG liquefaction plants through 2016. An LNG liquefaction capacity of 187.4 million metric tons per annum (MMtpa) is expected to be added globally by 2016. The increase in LNG liquefaction capacity is attributed to major planned LNG terminals in Australia, Papua New Guinea, Iran, Angola, Russian Federation and the US. The global planned LNG liquefaction capacity will account for 42% of the global LNG liquefaction capacity by 2016. Australia Will Emerge as the Largest Planned Capacity Aggregator by 2016 Australia will witness the highest addition in LNG liquefaction capacity globally during 2011–2016 through the planned commencement of its 14 LNG liquefaction terminals over this period. The expected increase in the planned LNG liquefaction capacity in Australia is accompanied with an increase in offshore gas and Coal Seam Gas (CSM) reserves in recent years. According to the BP Statistical Review 2010, the total proven natural gas reserves of Australia were 108.7 trillion cubic feet (tcf) in 2009. The CSM gas reserves in eastern Australia will provide feed gas to several planned
CSM-to-LNG projects that have recently concluded their Final Investment Decision (FID).Queensland Curtis LNG, Asia-Pacific LNG and Gladstone LNG are some of the key projects on the eastern coast of Australia, while Gorgon LNG, Prelude LNG and Sunrise LNG are the planned LNG liquefaction projects coming online in the western offshore region of the country. Australia plans to add a LNG liquefaction capacity of 84 MMtpa by 2016, translating into a percentage contribution of 45% to the global planned LNG liquefaction capacity addition by 2016 New Suppliers of LNG Will Contribute to 23% of the Global Planned LNG Liquefaction Capacity by 2016 A number of new gas suppliers such as Angola, Canada, Iran (Islamic Republic of Iran),Papua New Guinea and Venezuela will foray into LNG markets with the planned start of their LNG liquefaction terminals. An increase in gas discoveries, low domestic demand and investment from foreign players have all helped the countries to plan their LNG export projects. Papua New Guinea, Iran, Angola, Venezuela and Canada figure among such suppliers. These countries will start their LNG liquefaction terminals during 2011–2016. These countries plan to add a LNG liquefaction capacity of 43.2 MMtpa by 2016, accounting for a share of 23% in the global planned LNG capacity by 2016 Shale Gas Production in the US Will Expedite the Development of LNG Export Terminals in the US The transition of the US from a net importer of LNG to a net exporter looks inevitable
with the increase in shale gas production there over the last five years. In 2009, the US overtook Russia to become the largest natural gas producer, globally. Shale gas production in the US has increased from 3.5bcf/day to 8.5bcf/day in 2009 and it will increase significantly through 2016. The rise in shale gas has lowered US dependence on natural gas imports and created a surplus for LNG exports. The first LNG export terminal in the US commenced operations in 2010 and two more terminals are planned to start operations during 2011-2016. The two terminals will be located in the premises of existing LNG import terminals and may use the existing infrastructure for the re-export of LNG to major demand centers. Moreover, an anticpated increase in the difference between the spot gas prices in the US and Asian and European LNG markets will drive the growth of LNG exports from the US to Asia and Europe. The total planned LNG liquefaction capacity of the US will reach 17.5 MMtpa by 2016. For further details, please click or add the below link to your browser: http://www.globaldata.com/reportstore/Report.aspx?ID=Planned-LNG-Terminals-Market-Global-Analysis-Competitive-Landscape-and-Capacity-Forecasts-to-2016&ReportType=Industry_Report&coreindustry=Industry_Report&Title=Energy_and_Utilities&CompanyID=ssrve Europe’s Pursuit for Energy Security Through Diversification of Supply Source Will Trigger the Development of Planned LNG Regasification Terminals Through 2016
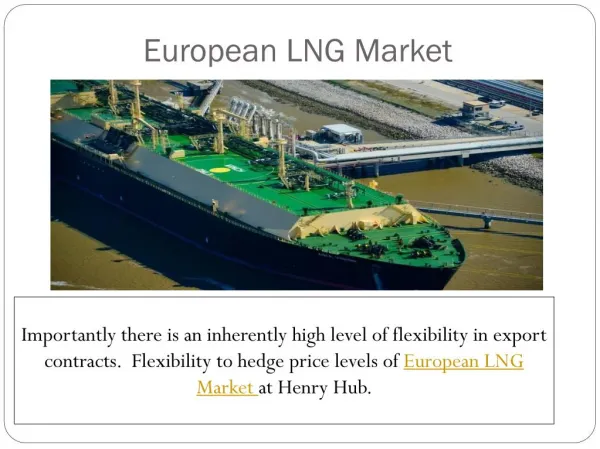
Europe’s demand for natural gas has increased, driven by extreme cold weather conditions there in recent years, and the increasing consumption of gas in power generation. Europe imports a sizable volume of gas as pipeline imports from Russia, under long-term oil-linked contracts. However, after the Russia-Ukraine dispute in 2009 and the resultant gas disruption, Europe felt the need to revisit its gas sourcing strategy. In recent years, Europe has strived to lower its dependence on Russian gas pipeline imports. The region started focusing on increasing its LNG imports and imports through alternative pipelines to meet its gas demand. According to BP Statistical review, pipeline imports to Europe declined from 375.78 billion cubic meters (bcm) in 2007 to 242.81bcm in 2009, at a negative Average Annual Growth Rate (AAGR) of 21.8%. On the contrary, LNG imports to Europe increased from 53.34bcm in 2007 to 69.02bcm in 2009, at an AAGR of 12.9%. LNG imports to Europe have increased following substantial LNG regasification development by European countries such as Italy and the UK. A number of countries are expected to join the ranks of LNG importers in the region and commence LNG imports during 2011–2016. The total planned LNG regasification capacity of Europe will account for 30% of the global planned LNG regasification capacity addition by 2016. India and China Along With New South Asian Buyers Will Sustain the Growth of Planned LNG Regasification Capacity Through 2016 Asia-Pacific is a traditional importer of LNG, with Japan, the Republic of Korea and Taiwan consuming significant quantities of LNG. In the mid-2000s, India and China
began importing LNG to meet their domestic gas shortfall. The two countries have aggressively increased their LNG regasification capacity during the last five years and will continue to do so through 2016. India and China will account for an increase of 14.6% and 56.4% in the global and Asia-Pacific’s planned LNG regasification capacity through 2016, respectively. Other South Asian countries such as Indonesia, Singapore, Bangladesh, Vietnam and Thailand are also planning to set up LNG regasification terminals to import LNG. Several of these countries are planning to construct floating LNG regasification facilities and charter floating LNG regasification vessels for a quick, low cost and flexible option to meet peaking or sudden increases in gas demand. The total planned capacity addition by new LNG importers in South Asia will account for 31.1% of the total planned LNG capacity of Asia-Pacific by 2016 “Planned LNG Terminals Market - Global Analysis, Competitive Landscape and Capacity Forecasts to 2016”, is the latest report from GlobalData, the industry analysis specialist, that offers comprehensive information on the global Planned Liquefied Natural Gas (LNG) terminal market. The report provides information on the planned LNG liquefaction and regasification terminals markets by region, focusing on major countries, operating companies and terminals in each region. It discusses the key factors affecting the growth of planned LNG terminals and highlights the key trends and issues in the planned LNG markets globally. The report also elaborates on the competitive scenario, detailing the operations of the major companies in the planned LNG markets globally. The information and analysis on the planned LNG markets is
based on proprietary databases, primary and secondary research and in-house analysis by GlobalData’s team of industry experts. For further details, please click or add the below link to your browser: http://www.globaldata.com/reportstore/Report.aspx?ID=Planned-LNG-Terminals-Market-Global-Analysis-Competitive-Landscape-and-Capacity-Forecasts-to-2016&ReportType=Industry_Report&coreindustry=Industry_Report&Title=Energy_and_Utilities&CompanyID=ssrve Visit our report store: http://www.globaldata.com/reportstore For more details contact: pressreleases@globaldata.com North America: +1 646 395 5477 Europe: +44 207 753 4299 +44 1204 543 533 Asia Pacific: +91 40 6616 6782