Download
1 / 19
190 likes | 197 Views
Caesarean section 19 november 2007 Evelyne Martens. Trends in caesarean section rate in Flanders (1987-2006). SPE DATA (1987-2006). Deliveries: 1.177.322 % CS rate Group I (1987-1991) 245.326 10.1 Group II (1992-1996) 320.087 12.7

E N D
Caesarean section 19 november 2007 Evelyne Martens
SPE DATA (1987-2006) • Deliveries: 1.177.322 % CS rate • Group I (1987-1991) 245.326 10.1 • Group II (1992-1996) 320.087 12.7 • Group III (1997-2001) 304.314 15.4 • Group IV (2002-2006) 307.595 18.1
Increase of caesarean section (1) Group (I-IV) Δ MULTIPLES 67 % 0.36 SINGLETONS Head, bw < 2,5 kg 59 % 0.48 Breech 89 % 1.87 Transverse 26 % 0.06 2.77 = 35 %
Increase of caesarean section (2)singleton, head presentation, birth weight ≥2.500g Group (I-IV)Δ SPONTANEOUS 78 % 3.94 Nulli 69 % 1.44 Multi 84 % 2.49 INDUCTION 98 % 1.33 Nulli 118 % 1.14 Multi 61 % 0.20
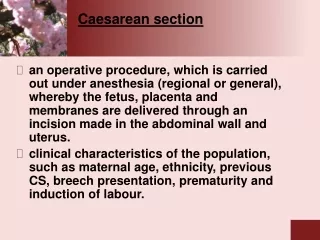
Low risk deliveries • Nulliparae • Singleton • Head presentation • Live born • Gestational age ≥ 37 weeks • Birth weight between 3 and 4 kg • No malformations
Low risk deliveries(1997-2006) Deliveries 175.926 PRIM. SEC 3.2 % SEC. SEC 9.0 %
Logistic regression on low risk group Walt-score Age of the mother 1044 Induction of labour 492 Hypertension 244 Birth Year 166 Diabetes 76 A.R.T. 11
Case-control low risk group1997 versus 2006 • Criteria • Same hospital • Same age of the mother • Same gestational age • Results: 1997 2006 Prim. Section 2.5 % 3.2 % Sec. Section 7.3% 10.1 %
Caesarean section (2001-2005) caesarean section by low risk ( 13,1 %)
Robson Classification (Flanders 2006) • Nulli, single, head, ≥ 37w, spont.3.7 • Nulli, single, head, ≥ 37w, induct, prim. sect 2.2 • Multi, single, head, ≥ 37w, spont.(excl. previous sect.) 1.1 • Multi, single, head, ≥ 37w, induct (excl. previous sect.) 0.4 • Previous section, single, head, ≥ 37w4.7 • Nulli breech 2.5 • Multi breech 1.5 • Multiple 1.9 • Transverse 0.3 • Single, head, ≤ 37w 1.5
All deliveries in the two extreme hospitals(2001-2005) Lowest CS rate Highest CS rate (9.7%) (24.9%) • 1.9 7.5 • 0.4 2.7 • 1.1 1.3 • 0.3 0.4 • 1.1 5.9 • 2.1 2.2 • 1.0 1.8 • 1.1 1.7 • 0.0 0.3 • 0.7 1.1 4.8 % 17.8 % 4.9 % 7.1 %
Low risk group (2001-2005) Lowest CS rate Highest CS rate % % Age mother ≥ 35 y 5.3 4.7 NS Induction of labour 18.9 32.6 0.000 Hypertension 1.8 4.3 0.01 Diabetes 0.6 0.6 NS A.R.T. 3.6 5.1 NS
Enquête caesarean section(16.11.2007) Distributed1190 (443) Partial answers 68 Return without answer 18 Full answers 460 Answers 528 45 %
Enquête caesarean section (n=141) Mean age 47 year (31-68) Mean delivery 199 (0-710) Gender Male - 54 % Female - 43 % ? - 3 % Type University 9 % Training center 25 % Peripheral 65 % Missing 1 %