Download
1 / 39
390 likes | 393 Views
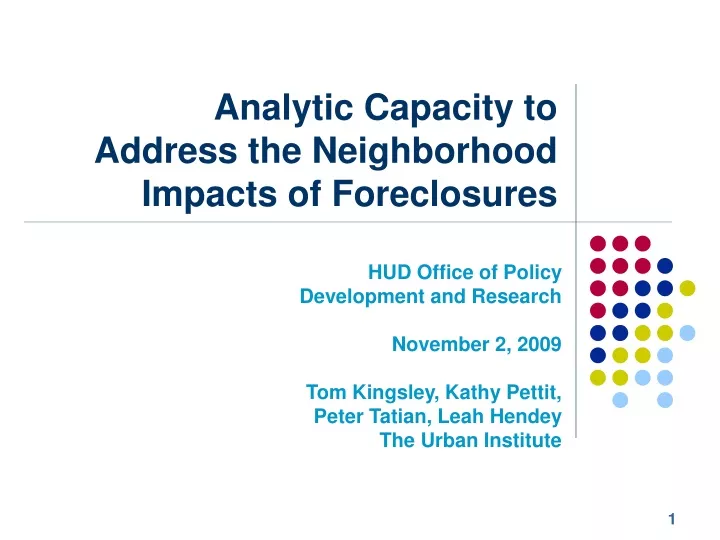
Analytic Capacity to Address the Neighborhood Impacts of Foreclosures. HUD Office of Policy Development and Research November 2, 2009 Tom Kingsley, Kathy Pettit, Peter Tatian, Leah Hendey The Urban Institute. THIS PRESENTATION. Urban Institute Approach & Experience Tom Kingsley

E N D
Analytic Capacity to Address the Neighborhood Impacts of Foreclosures HUD Office of Policy Development and Research November 2, 2009 Tom Kingsley, Kathy Pettit, Peter Tatian, Leah Hendey The Urban Institute
THIS PRESENTATION • Urban Institute Approach & Experience • Tom Kingsley • Working with NNIP to Address the Crisis • Kathy Pettit • Addressing Foreclosure Issues in the Washington DC Region • Peter Tatian
UI APPROACH • Assemble national datasets • Work involves assembly, cleaning, selecting indicators, structuring for ease of use • Developed the Neighborhood Change Database (NCDB – consistent census data since 1970) • These data systems – the content for DataPlace • Form working relationship with local practitioners • Coordinate the National Neighborhood Indicators Partnership (NNIP – since 1995) • Local data intermediaries – operate neighborhood level information systems in public interest • Number of local partners has grown (from 6 to 32)
NATIONAL DATA RESOURCES • Economy • Example: Zip Business Patterns • Education • Example: National Center for Education Statistics • Income/Savings • Example: Statistics of Income Individual Tax Data • Housing • Example: Home Mortgage Disclosure Act • Example: Section 8/Multifamily
NATIONAL NEIGHBORHOOD INDICATORS PARTNERSHIP (NNIP) • Local partners operate information systems • Recurrently updated neighborhood-level data • Multiple topics and data sources • Trusted institutions • Mostly outside of government • 38% University institutes, 33% stand-alone nonprofits • Rely on collaboration with other sectors and residents • Shared mission: Democratizing information • Practical applications central to mission • Direct work with stakeholders – stakeholders “own” the product
NATIONAL NEIGHBORHOOD INDICATORS PARTNERSHIP (NNIP) AtlantaBaltimore Boston Camden Chattanooga Chicago Cleveland Columbus Dallas Denver Des Moines Detroit Grand Rapids Hartford Indianapolis Louisville Los Angeles Memphis Miami Milwaukee Minneapolis Nashville New Haven New Orleans New York City Oakland Philadelphia Pittsburgh Providence Sacramento Saint Louis Seattle Washington, DC
Address level Employment Births, deaths Crimes TANF, Food Stamps Child care Health Schools Parcel level Prop. sales, prices Prop. ownership Foreclosures Assessed values Tax arrears Vacant/abandoned City/CDC plans LOCAL PARTNERS IN NNIPDATA FROM MANY SOURCES
NNIP – RECENT ACTIVITIES • Cross-site projects • Promoting school readiness and success • Supporting the Sustainable Communities Initiative • Addressing the foreclosure crisis • Tools • Catalog of Administrative Data Sources • Guide to Property Data • Continued support for aspiring partners • Portland, San Antonio, Kansas City
RECENT UI PROJECTS ON FORECLOSURE ISSUES • Literature review: impacts of foreclosures on families and neighborhoods (OSI) • Action research/data and strategy: Atlanta, Chicago, Washington (Fannie Mae) • Foreclosure-Response.org web site (with Center for Housing Policy & LISC, various sponsors) • Analysis for District of Columbia (D.C. Dept. of Insurance, Securities, Banking & Fannie Mae) • Analysis spatial patterns & policy, Washington DC Region (Housing in Nation’s Capital, Fannie Mae)
RECENT UI PROJECTS (continued) • Evaluation of National Foreclosure Mitigation Counseling Program (NeighborWorks) • Evaluation of Living Cities Neighborhood Stabilization Initiative (Living Cities) • Impacts on school children - Baltimore, New York, Washington (OSI) • Neighborhood typologies (foreclosure risk x market strength) – Atlanta, Baltimore, Louisville, Providence(with LISC, for Casey Foundation) • NSP2 Technical Assistance(part of LISC team)
Working with NNIP to Address the Crisis Kathy Pettit
Neighborhood Responses to the Foreclosure Crisis Symposium • Minneapolis, May 2009 • Co-sponsored by NNIP and University of Minnesota Center for Urban and Regional Affairs (CURA) • Workshops • Outreach/Organizing for Prevention • Managing Foreclosed Properties • Acquisition of Foreclosed Properties • Land Banking
Identifying Elderly At Risk of Losing Homes in Allegheny County Analysis by Pittsburgh Neighborhood and Community Information System 12,494 people named as defendants in foreclosure proceedings between 2006 and Nov. 2007 4,646 matches with Allegheny County Department of Human Service clients 2,214 of customers actively accessing resources 904 elderly identified (599 as active Area Agency on Aging consumers and 305 from voter records) 12,494 4,646 (33%) 2,214 (18%) 305 (2%) 599 (5%) +
Foreclosed Rental Propertiesin New York City Of the 15,000 foreclosure filings in 2007, 60% were on multifamily buildings. Foreclosures affected 30,000 households, 15,000 of which were renters
Foreclosure, Vacancy, & Abandonment in Memphis Neighborhoods Source: University of Memphis Center for Community Building and Neighborhood Action (CBANA)
Prices of Distressed Properties Leaving REO, 2005-08 Source: NEO CANDO, Case Western University N=2,941
Addressing The Foreclosure Crisis: Action Oriented Research • Atlanta Performed scan of foreclosure response system, convened stakeholders from across systems and counties, worked in-depth with DeKalb County • Chicago Worked with Greater Southwest Development Corporation to analyze foreclosure counseling clients wit administrative foreclosure data • Washington, D.C. (described later)
Children and Foreclosures • Baltimore, New York City, Washington, D.C. • Link public school student data with foreclosure data by address • Phase 1: Point-in-time • How Many? Who (race, tenure, ELL)? • What Neighborhoods? What Schools? • Phase 2: Post-foreclosure • Where do the families go? • How does it affect their academic outcomes? (absenteeism, test scores, drop-out rates)
1,400 D.C. students lived in a home in foreclosure, concentrated in a few areas. Public School Students in Parcels with Foreclosure Notice, SY 2008-2009
NNIP Roles in NSP/NSP2 • Locally: Proposal Planning, Implementation and Monitoring • 12 assisted in original NSP applications (city/county, state) • Nationally: Technical Assistance
Addressing Foreclosures in the Washington D.C. Region Peter Tatian
DC Housing Monitor • Quarterly update on D.C. housing market • Home and condominium sales, listings • Section 8 preservation • Foreclosures • Special analysis • Mortgage lending trends (HMDA) • Who owns the neighborhood? • Tracking subsidized housing http://www.NeighborhoodInfoDC.org/housing/
Prices dropping throughout the city,middle of market had steepest declines Four-quarter moving average of median price, single-family homes (2009 $ thousands)
Foreclosure inventory continues to rise, foreclosure starts and sales leveling off Single-family homes and condominium units, 1999 – 2009 Q2
Half of D.C. Households Affected by Foreclosures are Renters
Housing in the Nation's Capital • Annual report on housing conditions in the Washington, D.C., metropolitan area • Since 2002, regular updates of key indicators • Special analyses • 2003: Low-income housing • 2004 & 2005: Challenges from economic prosperity • 2006: Link between housing, neighborhoods, schools • 2007: Housing for populations with special needs • 2009: Foreclosures http://www.urban.org/center/met/hnc/index.cfm
Assisted local jurisdictions with NSP 2 applications • Provided both the District of Columbia and the Metropolitan Washington Council of Governments (MWCOG) with data to support their applications • Mapping of HUD foreclosure and vacancy indices • Local data on foreclosures • HMDA, MRIS, Census, BLS
Resources http://www.foreclosure-response.org NNIP Foreclosures – cross-site and local http://www2.urban.org/nnip/foreclosures.html NeighborhoodInfo DC Foreclosure Page http://www.neighborhoodinfodc.org/foreclosure/
Contact Information Metropolitan Housing and Communities Center The Urban Institute 2100 M Street, NW Washington, DC 20037 Tel (main): 202-833-7200 Web: www.urban.org Email: tkingsley@urban.org kpettit@urban.org ptatian@urban.org lhendey@urban.org