Download
1 / 31
340 likes | 599 Views
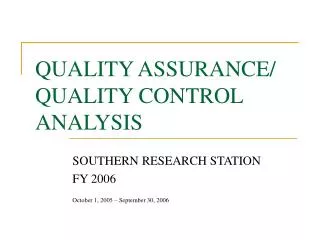
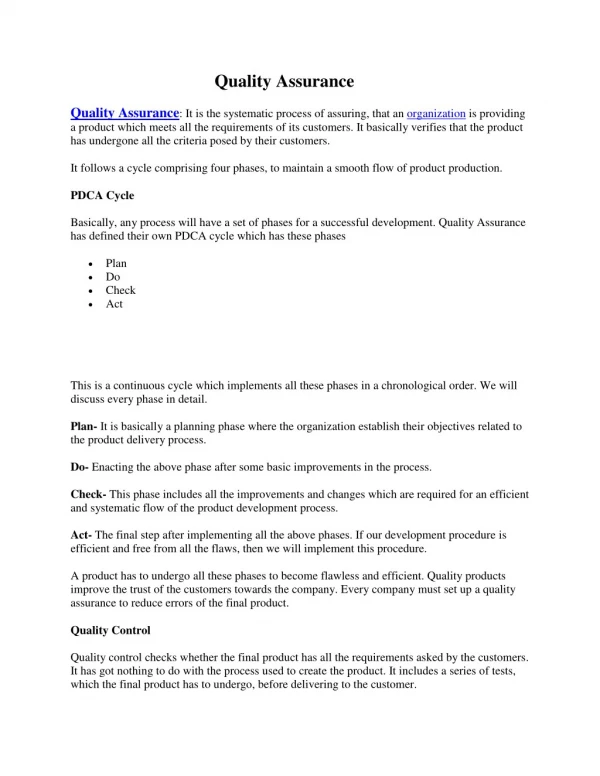
Quality Assurance (Quality Control). Inspection before/after production. Corrective action during production. Quality built into the process. Acceptance sampling. Process control. Continuous improvement. The least progressive. The most progressive. Phases of Quality Assurance.

E N D
Inspection before/after production Corrective action during production Quality built into the process Acceptance sampling Process control Continuous improvement The least progressive The most progressive Phases of Quality Assurance
Inputs Transformation Outputs Acceptance sampling Acceptance sampling Process control Inspection • How Much/How Often • Where/When • Centralized vs. On-site
Inspection Costs Cost Total Cost Cost of inspection Cost of passing defectives Optimal Amount of Inspection
Where to Inspect in the Process • Raw materials and purchased parts • Finished products • Before a costly operation • Before an irreversible process • Before a covering process
Statistical Process Control • The Control Process • Define • Measure • Compare to a standard • Evaluate • Take corrective action • Evaluate corrective action
Statistical Process Control • Variations and Control • Random variation: Natural variations in the output of process, created by countless minor factors • Assignable variation: A variation whose source can be identified
Samplingdistribution Processdistribution Mean Sampling Distribution
-3s -2s +2s +3s Mean 95.5% 99.7% Normal Distribution s = Standard deviation
a/2 a/2 Mean LCL UCL a = Probabilityof Type I error Control Limits (Type I Error)
Samplingdistribution Processdistribution Mean Lowercontrollimit Uppercontrollimit Control Limits
Mean Charts • Two approaches: • If the process standard deviation (s) is available (x • If the process standard deviation is not available (use sample range to approximate the process variability)
Mean charts (SD of process available) • Upper control limit (UCL) • = average sample mean + z (S.D. of sample mean) • Lower control limit (LCL) • = average sample mean - z (S.D. of sample mean)
Mean charts (SD of process not available) • UCL = average of sample mean + A2 (average of sample range) • LCL = average of sample mean - A2 (average of sample range) • A2 is a parameter depending on the sample size and is obtainable from table.
Example • Means of sample taken from a process for making aluminum rods is 2 cm and the SD of the process is 0.1cm (assuming a normal distribution). Find the 3-sigma (99.7%) control limits assuming sample size of 16 are taken.
Example (solution) • x = SD of sample mean distribution • = SD of process / (sample size) • = 0.1 / (16) = 0.025 • z = 3 • UCL = 2 + 3(0.025) = 2.075 • LCL = 2 - 0.075 = 1.925
Example(p.427) • Twenty samples of size 8 have been taken from a process. The average sample range of the 20 samples is 0.016cm and the average mean is 3cm. Determine the 3-sigma control limits.
Example • Average sample mean = 3cm • Average sample range = 0.016cm • Sample size = 8 • A2 = 0.37 (From Table 9-2) • UCL = 3 + 0.37(0.016) = 3.006 • LCL = 3 + 0.37(0.016) = 2.994
Control Chart Abnormal variationdue to assignable sources Out ofcontrol 1020 UCL 1010 1000 Mean Normal variationdue to chance 990 LCL 980 Abnormal variationdue to assignable sources 970 0 1 2 3 4 5 6 7 8 9 10 11 12 13 14 15 Sample number
UCL LCL 1 2 3 4 Observations from Sample Distribution Sample number
UCL x-Chart LCL UCL LCL Mean and Range Charts Detects shift Does notdetect shift R-chart
UCL x-Chart LCL UCL R-chart Detects shift LCL Mean and Range Charts UCL LCL Does notdetect shift
Control Chart for Attributes • p-Chart - Control chart used to monitor the proportion of defectives in a process • c-Chart - Control chart used to monitor the number of defects per unit
Use of p-Charts • When observations can be placed into two categories. • Good or bad • Pass or fail • Operate or do not operate • When the data consists of multiple samples of several observations each
p-chart • The center line is the average fraction (defective) p in the population if p is known, or it can be estimated from samples is it is unknown. • p = SD of sample distribution • = {p(1-p)/n} • UCLp = p + zp • LCLp = p - zp
Example (p.431) • The following table indicates the defective items in 20 samples, each of size 100. Construct a control chart that will describe 95.5% of the chance variations of the process
The following table indicates the defective items in 20 samples, each of size 100. Construct a control chart that will describe 95.5% of the chance variations of the process No. of defective items Example
Example (solution) • Population mean not available, to be estimated from sample mean • Total No. of defective items = 220 • Estimate sample mean = 220/{20(100)}=.11 • SD of sample = {.11(1-.11)/100}= 0.03 • z = 2 (2-sigma) • UCLp = .11 + 2(.03) = 0.17 • LCLp = .11 - 2(.03) = 0.05 • Thus a control chart can be plotted (p.431)
Use of c-Charts • Use only when the number of occurrences per unit of measure can be counted; nonoccurrences cannot be counted. • Scratches, chips, dents, or errors per item • Cracks or faults per unit of distance • Calls, complaints, failures per unit of time
LowerSpecification UpperSpecification Process variabilitymatches specifications LowerSpecification UpperSpecification Process variabilitywell within specifications LowerSpecification UpperSpecification Process variabilityexceeds specifications Process Capability