Download
1 / 9
90 likes | 172 Views
GIS K-12 in Delaware Schools. Presented by Nicole M. Minni. Overview. Map Projection Basics Creating Orange World Summer Vacation Atlas Fun in the sun with GIS. Projecting the Edible Globe. What is map projection?

E N D
GIS K-12 in Delaware Schools Presented by Nicole M. Minni
Overview • Map Projection Basics • Creating Orange World • Summer Vacation Atlas • Fun in the sun with GIS
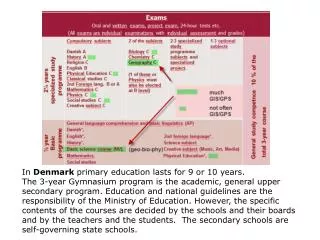
Projecting the Edible Globe • What is map projection? • The earth is a spheroid and to make a map you must represent it on a flat surface • This is accomplished by a mathematical transformation called a map projection • Map projections distort shape, area, distance, and direction. Some projections preserve one of these properties at the expense of others. • Uncontrolled • Controlled
Projections, continued • Sinusoidal • Countries are increasingly distorted away from the central meridian(s) and near the poles • Lambert Conformal Conic • retains conformity, distances true only along standard parallels, directions reasonably accurate, distortion of shapes minimal, but increases away from standard parallels • Robinson • better balance of size and shape of high latitude lands, but greatest distortion is near the poles • Mercator • preserves direction, but distorts shape Your choice of map projection allows you to control the type of distortion in a map for your area of interest.
Summer Vacation Atlas • Range of the project is the entire school year and relates to all areas of education • Math - measurements/calculations • History - Cape Henlopen Light House - WWII • Science - hypotheses • Biology - mollusks • Environmental - data attributes, overall care of beach • Reading and writing - report on activities, observations and conclusions.
Where to begin • Ask children what they want to discover about the Delaware Beaches • Possible responses are: • What beach is best for collecting shells? • What beach is best for collecting drift wood? • What beach is the trashiest? • What is the foam color, water color? • What beach has the best waves? • What beach is the widest? • What direction do the waves break on the beach?
Data Collection Sheet • Hand out data collection sheet • Select your first beach to visit • Gather as much information that you can while you are at the beach • take digital photos • complete data collection sheet, need clipboard • GPS unit, if available
Map Your Results • Open appropriate themes • Add data and attribute information • Review your analysis • Report your results • What is your favorite beach and why? • How did this study assist in your conclusions?
Extras • Lesson plan web site: • http://www.esri.com/k-12 = info on GIS in schools • http://www.esri.com/communityatlas = special project • http://www.esri.com/arclessons = GIS Lesson repository • http://www.esri.com/educ = Education User Conf, July 6-8, 2001 • Questions??? • Nicole M. Minni, • Water Resources Agency, Institute for Public Administration, College of Human Services, Education and Public Policy, University of Delaware • nminni@udel.edu • www.wr.udel.edu