Download
1 / 70
760 likes | 969 Views
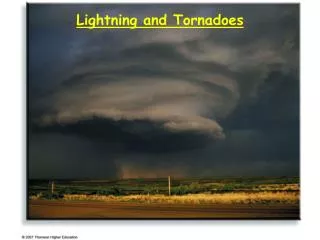
Lightning and Climate. Earle Williams MIT Franklin Lecture AGU Fall Meeting San Francisco, CA December 5, 2012. Outline. Global perspective on thunderstorms and world views CAPE versus aerosol control of lightning in present climate Natural variations in global temperature and lightning

E N D
Lightning and Climate Earle Williams MIT Franklin Lecture AGU Fall Meeting San Francisco, CA December 5, 2012
Outline Global perspective on thunderstorms and world views CAPE versus aerosol control of lightning in present climate Natural variations in global temperature and lightning Impact of urban areas on lightning Increases in lightning at high northern latitude Puzzlements on 11 year solar cycle Long-period trends and stability of tropical chimneys Lightning and atmosphere chemistry Expectations for lightning in a warmer world Conclusions
World Views Majority View Weather & Climate Electrification & Lightning Thermodynamics Aerosol Minority View Electrification & Lightning Weather & Climate Cloud microphysics Atmospheric chemistry Forest fire initiation
World Views on Variability of Lightning Both aspects are crucial considerations for climate change • Role for Thermodynamics • Temperature, CAPE, cloud base height are main causal variables • Role for aerosol • Cloud condensation nuclei are key components
Natural frameworks for monitoring global electrification AC Global Circuit Schumann Resonances DC Global Circuit Integrator of Electrified Weather Integrator of Global Lightning
Why should lightning activity follow surface air temperature? Vapor Pressure Temperature (°C) • In all climates, water vapor increases with increasing temperature (Clausius-Clapeyron relationship) + 7% per degree C at 0°C • In the present climate, Convective Available Potential Energy (CAPE) increases with temperature
Convective Available Potential Energy (CAPE) Moist Adiabat Temperature Profile
CAPE – Lightning Relationships Southeast Asia (Siingh et al., 2012) India (Pawar et al., 2011) CAPE (J/kg) Lightning Flash Count Years
Global climatology of Convective Available Potential Energy (CAPE)(from Riemann-Campe, 2010)
Global Climatology of CAPE NASA GISS GCM(Del Genio, 2012) • One year of model results
Illustration of aerosol hypothesis for thunderstorm electrification Model Support from: Khain et al. (2005) Li and Zhang (2008) Mansell and Ziegler (2012)
First global map of aerosol concentration (Shiratori, 1934) Observations from Carnegie cruises Particles/cc
Role of aerosol in cloud buoyancy and land/ocean updraft contrast CAPE debate: Saunders (1957) Betts (1982) Xu and Emanuel (1989) Williams and Renno (1993) Lucas and Zipser (1994) Rosenfeld et al. (2008) Riemann-Kampe (2010) How should CAPE be calculated for land and ocean? 0°C 0°C • Reversible CAPE • Lift the condensate as droplets • Benefit from latent heat of freezing • Appropriate for polluted continents • Irreversible CAPE • Condensate removed by warm rain • Superadiabatic loading of updraft • Appropriate for clean oceans
Outline Global perspective on thunderstorms and world views CAPE versus aerosol control of lightning in present climate Natural variations in global temperature and lightning Impact of urban areas on lightning Increases in lightning at high northern latitude Puzzlements on 11 year solar cycle Long-period trends and stability of tropical chimneys Lightning and atmosphere chemistry Expectations for lightning in a warmer world Conclusions
Natural time scales with a global lightning response Diurnal Semiannual Annual ENSO
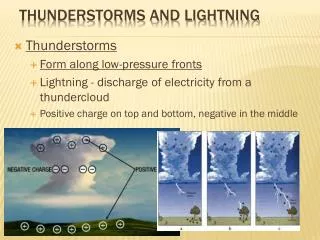
Thunderstorm Day AMS Glossary definition for Thunderstorm Day: An observational day during which thunder is heard at the station
Diurnal Variation of Global Lightning Lightning Flash Density Carnegie Curve Thunder Area
Global circuit temperature dependence- diurnal time scale (Markson, 2003) Ionospheric Potential (kV) Slope ~7% change Vi per °C Temperature (C)
Evidence for Semiannual variation in lightning activity 23° Physical origin : 23° obliguity of Earth’s orbit Authors Observations • Williams (1994) • Satori and Zieger (1996) • Fϋllekrug and Fraser-Smith (1997) • Nickolaenko et al. (1998) • Manohar et al. (1999) • Christian at al (2003) • Satori et. al. (2009) • Hobara et al. (2011) • Thunder days • Schumann resonances • ELF • Schumann resonances • Surface observations • OTD satellite • Schumann resonances • Schumann resonances
Semiannual time Scale:Seasonal variation of insolation and air temperature for the tropics
Evidence for semiannual variation in lightning from the Optical Transient Detector (Christian et al., 2003)
Semiannual signal in Congo River discharge Drainage area Annual discharge record Aug Dec Apr Aug
Annual variation of global temperature and global lightning (11% change/°C) Global temperature variation (Williams et al., 1994) Global lightning variation (Christian et al., 2003)
Seasonal variation of global lightning activity (Christian et al., 2003) Global Maximum
El Nino Southern Oscillation (ENSO) Best evidence: Pre-monsoon thunderstorms everywhere are more electrically active than monsoon thunderstorms Tropical ‘chimney’ regions are in stronger subsidence in the warm El Nino phase (from Pacific Ocean upwelling) Best evidence: The discharge of the Amazon and Congo rivers is reduced during this warm phase Strong thunderstorm activity favored by synoptic scale subsidence
Variations in lightning activity on the ENSO time scale • Evidence for higher temperature in El Nino phase over tropical continental ‘chimneys’ • Hansen and Lebedeff (1987) • Evidence for greater lightning (and reduced rainfall) in the El Nino phase • Hamid, Kawasaki and Mardiana (2001) • Yoshida, Morimoto, Kawasaki and Ushio (2007) • Chronis, Goodman, Cecil, Buechler, Robertson, Pittman and Blakeslee (2008) • Pinto (2009) • Satori, Williams and Lemperger (2009) • Kumar and Kamra (2012) • Evidence for increase in exceptional oceanic lightning and ELVES • Wu et al. (ISUAL Satellite Team) (2012)
Zonal variation of lightning enhancement in warm El Nino phase Mean ratio = El Nino lightning La Nina lightning “from Satori et al. (2009)”
Outline Global perspective on thunderstorms and world views CAPE versus aerosol control of lightning in present climate Natural variations in global temperature and lightning Impact of urban areas on lightning Increases in lightning at high northern latitude Puzzlements on 11 year solar cycle Long-period trends and stability of tropical chimneys Lightning and atmosphere chemistry Expectations for lightning in a warmer world Conclusions
Lightning enhancement over Houston, Texas (Steiger et al., 2002)
Evolution of thunderstorm days and temperature in Sao Paulo, Brazil (Pinto,2009) Sensitivity: ~10% change in thunder days per °C Slope ~3.6 °C/century
Evidence for a weekly cycle in lightning Sao Paulo, Brazil (Farias et al.,2009) Southeastern United States (Bell et al., 2009) Number of Lightning Days Flash Rate Weekend Weekend Weekend
Evidence for role of aerosol in lightning activity (Farias et al., 2009) “Control” of temperature Lightning dependence on aerosol concentration See also model results by Mansell and Ziegler (2012)
Outline Global perspective on thunderstorms and world views CAPE versus aerosol control of lightning in present climate Natural variations in global temperature and lightning Impact of urban areas on lightning Increases in lightning at high northern latitude Puzzlements on 11 year solar cycle Long-period trends and stability of tropical chimneys Lightning and atmosphere chemistry Expectations for lightning in a warmer world Conclusions
Global warming most pronounced at high northern latitude (NASA GISS) Northern Latitudes Tropics only Southern Latitudes
Thunderstorm Days versus Summer Temperature: Fairbanks, Alaska (65°° N) Thunderstorm Day Trend 300% change/century Summertime Temperature Trend 3.2 °C/century
Outline Global perspective on thunderstorms and world views CAPE versus aerosol control of lightning in present climate Natural variations in global temperature and lightning Impact of urban areas on lightning Increases in lightning at high northern latitude Puzzlements on 11 year solar cycle Long-period trends and stability of tropical chimneys Lightning and atmosphere chemistry Expectations for lightning in a warmer world Conclusions
Thunderstorm days on the 11-year solar cycle Brooks (1934) Global sites In phase behavior No time series Klejmenova (1967) Global sites Out-of-phase behavior No time series Girish and Eapen (2008) India (tropics) Out-of-phase behavior Yes, time series Siingh et al. (2012) Southeast Asia Out-of-phase behavior Yes, time series Pinto et al. (2012) Brazil stations Out-of-phase behavior Yes, time series Pinto et al. (2012)
Richness of frequency information in Schumann resonances (Satori, 2012) On display: 11-year cycle Annual thunderstorm migration Northward migration due to warming Solar Max Solar Min Solar Min
Outline Global perspective on thunderstorms and world views CAPE versus aerosol control of lightning in present climate Natural variations in global temperature and lightning Impact of urban areas on lightning Increases in lightning at high northern latitude Puzzlements on 11 year solar cycle Long-period trends and stability of tropical chimneys Lightning and atmosphere chemistry Expectations for lightning in a warmer world Conclusions
Time-dependent lightning detection by global networks Vaisala GLD360 (R.Said) World wide Lightning Location Network (WWLLN) (C. Rodger) Lightning Strokes (millions) Million Strokes
National Lightning Detection NetworkAnnual totals: Ground Flashes (numerous Orville papers) North American Coverage East Coast Network Full CONUS Coverage
Decade record from Lightning Imaging Sensor (NASA MSFC)(Best record available of global lightning)
Four-decade record of ionospheric potential (Markson, 2007) Positive trend +16% per century but not statistically significant
Trend in four-decade record of air-earth current at Kew (London) Positive trend +25% per century and statistically significant Harrison and Ingram (2005)
High and low water marks in Amazon basin at Manaus (1903-present) Positive trends - statistically significant +4 % change per century +1 % change per century
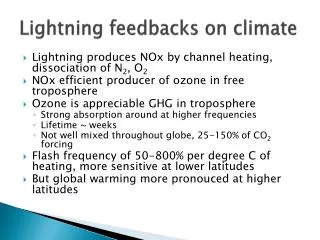
Trend in discharge of Congo River (1905-1985) Positive trend +15% per century and statistically significant