Download
1 / 24
240 likes | 415 Views
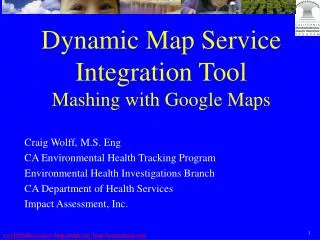
Dynamic Map Service Integration Business Case for Implementation. Craig Wolff, M.S. Eng CA Environmental Health Tracking Program Environmental Health Investigations Branch CA Department of Health Services Impact Assessment, Inc. CA Environmental Health Tracking Program (CEHTP).

E N D
Dynamic Map Service IntegrationBusiness Case for Implementation Craig Wolff, M.S. Eng CA Environmental Health Tracking Program Environmental Health Investigations Branch CA Department of Health Services Impact Assessment, Inc.
CA Environmental Health Tracking Program (CEHTP) • Enhance, exchange, integrate, analyze, disseminate, and visualize environmental hazard and health outcome data • Facilitate transformation of data to “information” that is more usable/actionable by researchers/stakeholders • Identified 40+ databases/systems of interest • CEHTP is a service organization
Some CEHTP Principles, not all • Environmental health tracking data should be infused into as many relevant mediums as possible • Local, State, Federal, non-governmental • Analog (e.g. paper) and digital (e.g. websites) • CEHTP does not disseminate confidential data • Partners produce/consume data and services with ease
Map Visualization Principles • CEHTP and/or system owners provide easy, systematic, and standards-based access to GIS data for dynamic interactive mapping • CEHTP and/or system owners maintain maximal control over look-and-feel of GIS data • CEHTP and/or system owners focus resources on data within their jurisdiction
How a Typical Interactive Map Works • Browser-based client has controls that take zoom, pan, layer visibility, etc. parameters and process into request to map server • Map server receives request for map • Map server processes request into an image file • Browser-based client displays image file
Typical Map Server Paradigm • Procure hardware, software, staff resources, • Acquire (often buying) all GIS data to be used in map service, import into platform, configure rendering specifications for every GIS dataset/layer • Develop a customized browser-based client to consume map service
Evolving Map Service Paradigm • Provide Uniform Resource Locator (URL) access to commonly used GIS layers and, perhaps, give a limited set of choices for visual rendering • Interface specifications (URL parameters) for requesting map image follow a consensus-based standard • OpenGIS Web Map Service (WMS): TerraServer, USGS
WMS URL Specs • URI: Server name, directory, endpoint • Request: GetCapabilities | GetMap | GetFeatureInfo • BBOX: xMin, yMin, xMax, yMax • LAYERS: layer1, layer2 • STYLES: style1, style2 • FORMAT: image/jpeg • WIDTH: 400 • HEIGHT: 600 • SRS: EPSG:4326 • Go to http://www.opengeospatial.org for more info
TerraServer WMS Example URL:http://terraserver.microsoft.com/ogcmap6.ashx?version=1.1.1&request=GetMap&Layers=DOQ&Styles=&SRS=EPSG:26910&BBOX=547200,4182400,553600,4186400&width=800&height=500&format=image/jpeg&Exceptions=se_xml
Google/NASA Tip the Scale • Google Earth and NASA Worldwind display image tiles of basemap and satelite/aerial imagery of the whole earth • Physical air travel by humans decreases • Google Local provides easy to use browser-based clients that incorporate emerging WWW technologies (AJAX) and map image tiles
Google/Hackers Redefine Browser-Based Interactive Mapping • Google Maps API makes it tremendously easy to put dynamic maps with basemap and high-res satelite imagery on any* website with no non-standard plug-ins • See http://www.google.com/apis/maps/ • Hackers figure out how to integrate WMS content in Google Maps API • See http://blog.kylemulka.com/?p=287 *Commercial sites must pay
Tracking Trials/Tribulations • Two partners to visualize CEHTP pilot project data through custom interactive map server/client implementations • Stumbled through GIS data exchange, metadata, and appropriate layer rendering • Loss of control, miscommunication, map server/client platforms too “closed” • Need enterprise solution that makes integration and standards a top priority
Google API Drawbacks • Map client can only display 2 overlapping image tiles simultaneously (“Hybrid) • Even if one of those tiles was non-Google data (ie. your own tile data), image opacity is not consistently or elegantly supported across browsers • Multiple tiles must be overlaid on server-side
CEHTP Custom WMS Layering • Develop server-side utility that overlays multiple map server image tiles • Support for consuming most popular map server output (ie. ArcIMS, WMS, UMN MapServer, ArcWeb services) • Support for individual layer transparency and opacity • Support for server-side caching (~Google speed) • Invocation interface is WMS (ie. standard URL access)
Recursion on the WMS LAYERS parameter • Recursion: “A programming technique in which a function may call itself.” • WMS LAYERS parameter is another WMS request (or an ArcIMS request or a MapServer request) • HTTP encode each LAYERS parameter • Opacity specified through STYLES parameter
Custom WMS request URL Geek speak: http://maps.ehib.org:8080/servlet/MapService?LAYERS=aims%28http%3A//maps.ehib.org%3FSERVICE%3Drepro%26PORT%3D5300%26LAYERS%3D8%26FORMAT%3Dimage/gif%26STYLES%3Ddefault%26TRANSPARENT%3Dtrue%26reaspect%3Dfalse%29,wms%28http%3A//ims.cr.usgs.gov%3A80/servlet19/com.esri.wms.Esrimap/USGS_EDC_LandCover_NLCD_Merged%3FLAYERS%3DUS_NED_Shaded_Relief%3BUS_NLCD%26FORMAT%3Dimage/gif%26STYLES%3Ddefault%26TRANSPARENT%3Dfalse%26reaspect%3Dfalse%29&SRS=EPSG:4326&STYLES=1.0,1.0&WIDTH=500&HEIGHT=500&FORMAT=image/jpeg&TRANSPARENT=TRUE&EXCEPTIONS=INIMAGE&VERSION=1.1.0&REQUEST=GetMap&BBOX=-122.3437,37.7185,-121.9921,37.9961 English: Alameda County preterm birth data on top of USGS landuse and elevation data. Different servers, real-time
Content-Specific Custom WMS(Pesticides) • Use the WMS LAYERS and TIME parameters to embed detailed data drill-downs on slicey dicey data URL: LAYERS=ALL|C~ALL|lbs_sum&TIME=2003 • Statewide (ALL counties), ALL possible pesticides/chemcodes, 2003 sum of pesticides within County, Township, or Section (forced scale-dependency) • URL: LAYERS=01|C~00385|applic_rt&TIME=1998 • Alameda County, methyl bromide, 1998 application rate (pounds/acre)
Bringing it Together • Dynamic Map Service Integration Demo • Special thanks to CADPR, CA West Nile Virus Surveillance Program, and Center for Vectorborne Diseases (CVEC) for providing data (map services)
Add in West Nile Virus bird death siting UC Davis service as layer