Download
1 / 19
190 likes | 305 Views
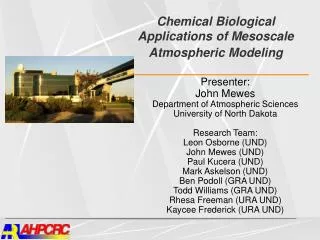
Intercomparison of Mesoscale and Global Atmospheric Transport Models over Western Europe.

E N D
Intercomparison of Mesoscale and Global Atmospheric Transport Models over Western Europe P. Ciais2), A.T. Vermeulen1), C. Geels3), P. Peylin2), M. Gloor4), P. Bousquet2), T. Aalto, J. Brandt3), J. H. Christensen3), R. Dargaville, L. M. Frohn3), M. I. Gusti2), M. Heimann4), S. Houweling4), U. Karstens5), S. Körner4), I. Levin6), V. Montandon2), M. Ramonet2), C. Rödenbeck4) and M. Schmidt2). 1)Energieonderzoek Centrum Nederland (ECN), Westerduinweg 3, P. O. Box 1, 1755 ZG Petten, The Netherlands. 2)CNRS-LSCE, LSCE, Centre d’études l’Orme des Merisiers, Bât. 709, 91191 Gif-sur-Yvette Cedex, France. 3)National Environmental Research Institute, Department of Atmospheric Environment, Frederiksborgvej 399, P. O. Box 358, 4000 Roskilde, Denmark. 4)Max-Planck-Institut für Biogeochemie, Postfach 10 01 64, 07701 Jena, Germany. 5)Max-Planck-Institut für Meteorologie, Bundesstr. 55, 20146 Hamburg, Germany. 6)Universität Heidelberg, Heidelberg, Germany
Objectives • Evaluate ATMs for their ability to simulate synoptic variability (see regional inversions) • Compare ATMs for diurnal rectification • Compare global (coarse res) and mesoscale (fine res) models • Evaluate ATMs to simulate mean gradients • The tracers triad : • 222Rn : “known “ source ; “known “ patterns • FF-CO2 (14CO2 ) : known source ; uncertain patterns • CO2 : unknown source ; unknown patterns
Station locations Red = CO2 Yellow = CO2 in situ Green = 222Rn in situ Blue = 14C Black = eddy flux towers (not used)
Intercomparison set-up Period July 1998 ; December 1996 Winds ECMWF 6-hourly 222Rn Constant emission over non-iced lands 1 atom cm-2 sec-1 CO2 Air sea fluxes from takahashi, 1999 Air-land fluxes from LUE model TURCB Fossil fuel emissions from Andres et al. Atm. boundary conditions from CTM3FG(X,t) Diagnostics Monthly mean patterns (daytime ; full time) Monthly mean gradients among stations Time series at stations Average diurnal cycle at stations
Mars Avril Mai Juin Juillet Août Sept. Oct. Remarks on prescribed air-land fluxes Include diurnal cycle of NEE ; Agreement with eddy flux data Eddy data TURCB Bayreuth [ gC / m2 / jour ] Tharandt [ gC / m2 / jour ] semaines Seasonal cycle too strong & too early in Europe ; No missing sink to close the N.H. budget (see Rivier’s talk) Europe N. Asia [ gC/m2/jour ] [ gC/m2/jour ] Inversion TURCB
Mapping the 222Rn signal Jul. Dec.
Mapping the 222Rn signal Jul. Dec.
Longitudinal Stations Transect at 45-60°N July 1998 (FF from radiocarbon data Levin et al.)
222Rn time series JULY Coastal Surface Mountain 1205 m
222Rn time series DECEMBER Coastal baseline Surface Germany Surface Russia
CO2 time series Mountain Germany 1205m Tower hungary 115m High Alt. italy 3405m
Preliminary conclusions • Large differences in vertical mixing; with global models LMDZ, TM3FG tending to mix more strongly • Inter model differences not similar in Jul vs. Dec • All models capture the longitudinal mean gradient in 222Rn and FF-CO2 ; differ for diurnal rectification of bio-CO2 • Mesoscale models (generally) better capture the diurnal cycles • All models capture correct the timing of synoptic variability ; differ in the amplitude of the synoptic events • Continuous 222Rn, 14CO2, CO2 records have complementary usefulness • Data selection of in-situ records to be improved
REMO-D HANK DEHM In short …. TM3-FG LMDZ strong weak Overall strength of vertical mixing over continent Too high Fossil CO2 ; 222Rn continentality gradient at stations Ok Variability and correlation with obs.time series 222Rn ; JUL Too small Too large Variability and correlation with obs.time series 222Rn ; DEC