Download
1 / 2
20 likes | 29 Views
Learn the basics of fundamental analysis of stocks & how to perform equity analysis to understand company's profitability. To know more - https://www.researchandranking.com/blog/6-key-ratios-while-doing-fundamental-analysis-of-stocks/

E N D
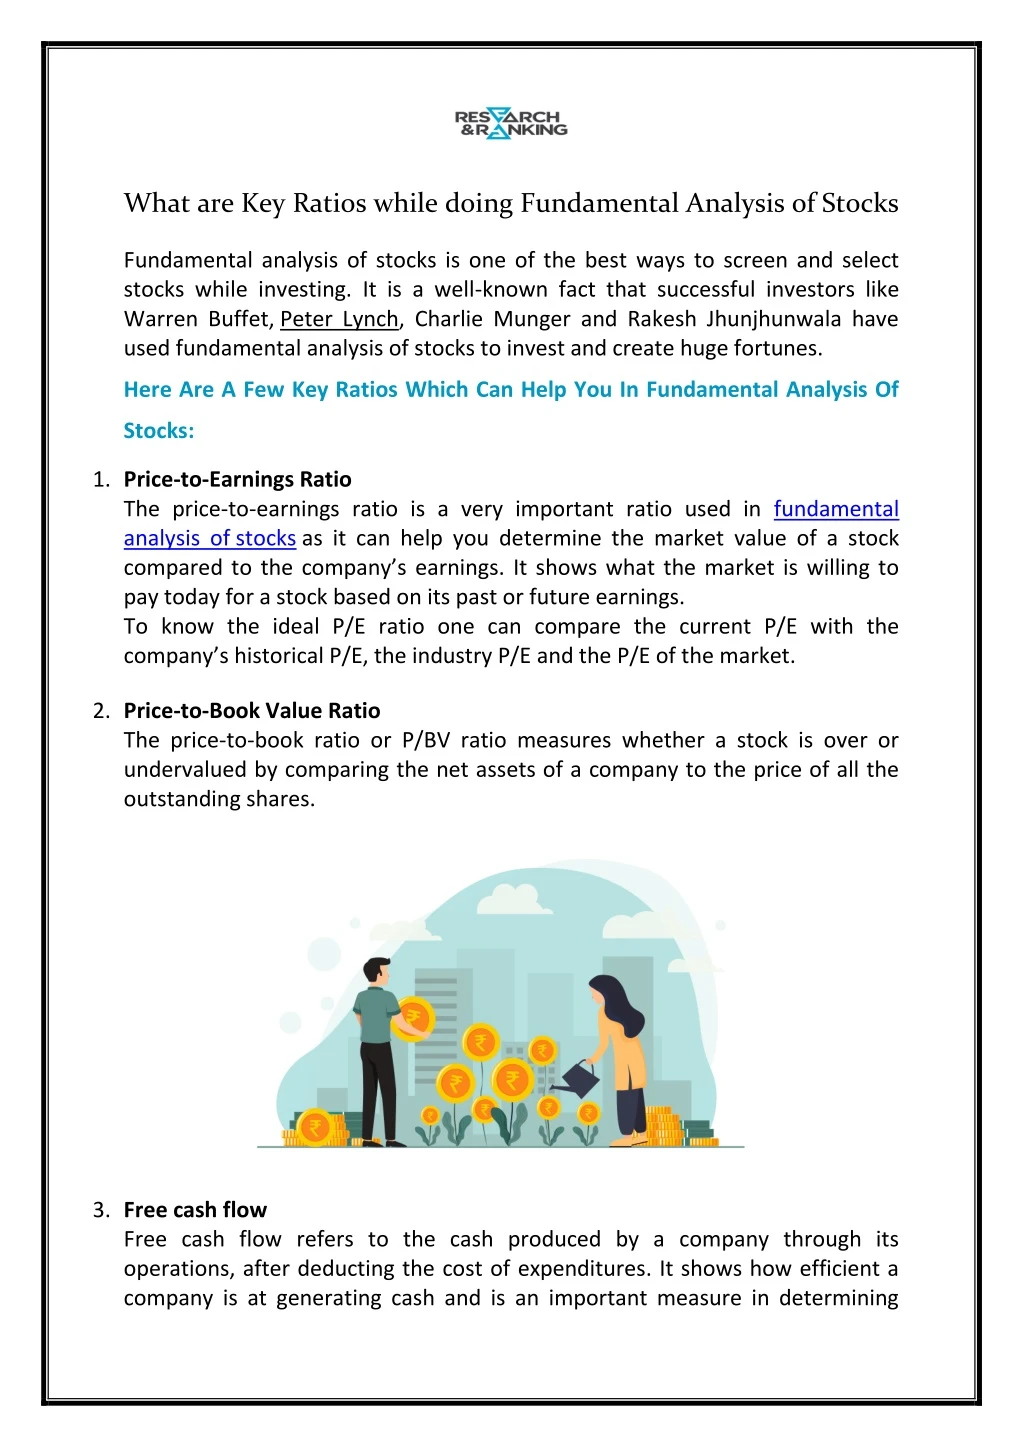
What are Key Ratios while doing Fundamental Analysis of Stocks Fundamental analysis of stocks is one of the best ways to screen and select stocks while investing. It is a well-known fact that successful investors like Warren Buffet, Peter Lynch, Charlie Munger and Rakesh Jhunjhunwala have used fundamental analysis of stocks to invest and create huge fortunes. Here Are A Few Key Ratios Which Can Help You In Fundamental Analysis Of Stocks: 1.Price-to-Earnings Ratio The price-to-earnings ratio is a very important ratio used in fundamental analysis of stocks as it can help you determine the market value of a stock compared to the company’s earnings. It shows what the market is willing to pay today for a stock based on its past or future earnings. To know the ideal P/E ratio one can compare the current P/E with the company’s historical P/E, the industry P/E and the P/E of the market. 2.Price-to-Book Value Ratio The price-to-book ratio or P/BV ratio measures whether a stock is over or undervalued by comparing the net assets of a company to the price of all the outstanding shares. 3.Free cash flow Free cash flow refers to the cash produced by a company through its operations, after deducting the cost of expenditures. It shows how efficient a company is at generating cash and is an important measure in determining
whether a company has sufficient cash to reward shareholders through dividends and share buybacks. 4.Debt-to-Equity The debt-to-equity ratio (D/E) reveals how a company finances its assets. The ratio shows the proportion of equity to debt a company is using to finance its assets. A low debt-to-equity ratio means the company uses a lower amount of debt for financing as opposed to against equity via shareholders. A company with high levels of debt means high risk the company doesn’t have the earnings or cash flow to meet its debt obligations. 5.Return On Equity Return on equity (ROE) is an important measure in fundamental analysis of stocks as it denotes the return that shareholders get from the business and overall earnings. This is useful in comparing the profitability of companies in the same industry and is also a yardstick for measuring the management’s capability to conduct the business efficiently. ROE can be calculated by dividing the net income by the shareholder equity. 6.Dividend Yield Dividend yield can be calculated by dividing the dividend per share by the share price. A high dividend yield usually indicates the company is doing well financially A low dividend yield however does not mean that the company is doing well as many companies in growth stage may choose to reinvest all their earnings for business expansion. To summarize, fundamental analysis of stocks is the best way to select stocks for long term investment. Contact us Address –712, Raheja Chambers, Nariman Point, Mumbai, Nariman Point, Mumbai, 400021, India Phone–022-61013838 Website–https://www.researchandranking.com/