Download
1 / 33
330 likes | 415 Views
Study of Past High School Graduates. Presentation for ESD 189 Assessment Directors November 30, 2018 Pete Bylsma, Director, Assessment/Program Evaluation Mukilteo School District. What Do You Want to Know?. What information do you want to know about your HS graduates?

E N D
Study of Past High School Graduates Presentation for ESD 189 Assessment Directors November 30, 2018 Pete Bylsma, Director, Assessment/Program Evaluation Mukilteo School District
What Do You Want to Know? What information do you want to know about your HS graduates? What else do you want to know about students who have left your district?
Rationale and Methods The District’s vision is to ensure success for every student at each grade level so students graduate career and college ready. Ways we assess success: • Give a senior exit survey and analyze graduation rates. • Use data from the National Student Clearinghouse (NSC) to track college attendance, persistence, and graduation. • Send surveys to graduates to gather data on post-HS education, work, and other factors (e.g., financial aid, living situation, reflections on HS experiences).
Analysis Context District demographics have changed dramatically during the last 20 years.
Analysis Context District demographics have changed dramatically during the last 20 years.
Analysis Context Mukilteo has higher FRL and EL rates than the state.
High School Exit Survey Past Present Profile + Purposeful Career & College Ready Planning Common survey + collaboration across District Follow-up surveys (longitudinal data) include reflections from graduates & comparison data over time • Results in HS Profile vary by school • Included a final transcript request (Parchment) • General sense of post-HS pathways at individual schools • One “sliver" of time regarding chosen pathway
District On-Time Graduation Rates Declined a Bit Rates for the Class of 2015 - 2017 Source: OSPI
District On-Time Graduation RatesExceed the State Source: OSPI
National Student Clearinghouse (NSC) Data • NSC’s database tracks attendance at almost all 2-year and 4-year institutions in the nation (99% coverage). • Not a sample or self-reported, so results are accurate and nearly complete. • NSC includes information on college enrollment, college persistence (enroll again in the 2nd year), and college graduation for the District and each high school.(We provide them with the names of graduates each year.) • Employment information is not reported.
College Attendance Among MSD Graduates • Enrollment rates of graduates at 2-year and 4-year colleges slowly declined as the economy improved. • Most high school graduates eventually attend college. How is this information helpful? What else do you want to know? Source: NSC
District data hide differences in high schools Total students % FRL % EL May 2017 4,462 39.8% 9.1% ACES 201 59% 9% Kamiak (KA) 2,065 17% 4% Mariner (MA) 2,096 59% 14% May 2015 4,320 41.2% 6.8% ACES 199 60% 9% Kamiak 2,042 17% 2% Mariner 2,079 63% 11% May 2013 4,306 42.6% 6.5% ACES 186 71% 10% Kamiak 2,097 18% 3% Mariner 2,023 65% 10% Total 13,088 41.2%7.5%
College Attendance Among MSD Graduates Most high school graduates attend some type of college within 8 years, but the rate varies by school. Source: NSC
College Attendance Among MSD Graduates Most graduates attend 4-year colleges; those from higher poverty schools initially attend 2-year colleges much more often. Source: NSC
Where Graduates Attend College Most graduates attending college stay in Washington. Of the graduates who attended college during the past 8 years: 73% stayed in the Puget Sound area 11%attended other WA institutions 16% went out of state (8% were in 5 western states). *CA, OR, ID, NV, AZ Source: NSC
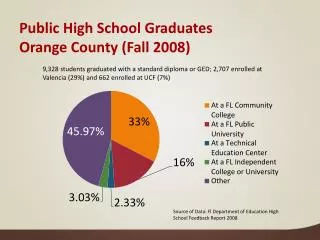
Where Graduates Attend College 76% attended one of these 12 post-secondary institutions. Two-Year Colleges Avg/Year 99 55 17 13 124 39 33 13 8 6 5 5 Four-Year Colleges Source: Analysis of NSC data
Most Graduates Attend Public Institutions Source: Analysis of NSC data
College Attendance by School All Students Source: Analysis of NSC data
College Enrollment Among MSD Graduates Males, Blacks, & Hispanics attend college less often. Source: NSC
College Persistence Among MSD Graduates Source: NSC
College Graduation Rates Source: NSC
District Surveys • Online survey examined the Class of 2017 (hard copy mailed to those lacking an email address). • Questions relate to HS experiences, college, and work. • Final GPA, courses taken, high school & beyond plan, extra-curricular activities • Type of post-secondary education, full-time vs. part-time, remedial courses, GPA, school(s) attended and major, funding sources • Work type, full-time vs. part-time, length of employment • Hard copy survey sent to grads in Classes of 2013 and 2015 (3 and 5 years after HS graduation) asks more questions. • Demographic data allow analyses by race and gender.
Survey Responses of Graduates # graduates # responses Response Rate Class of 2017 967 250 25.9% ACES 50 8 16% Kamiak 467 185 40% Mariner 450 57 13% Class of 2015 895 194 21.7% ACES 49 4 8% Kamiak 453 122 27% Mariner 393 68 17% Class of 2013 915 234 25.6% ACES 49 8 16% Kamiak 476 143 30% Mariner 390 83 21% Total 2,777 67824.4%
All Graduates vs. Survey Responses Respondents are somewhat representative of all graduates. Final GPA * American Indian, Pacific Islander
Most graduates had a good or very goodhigh school experience Q: As you reflect back on your entire time at ___ High School, which of the following best describes your current opinion of your overall experience?
Graduates felt more prepared for college than for work and life Q: How well did ______ High School prepare you for each of the following? Percent indicating Good or Excellent preparation (4 or 5 on 5-point scale)
Graduates generally felt supported Q: How well did ______ High School support you in the following areas? Percent indicating Good or Excellent support (4 or 5 on 5-point scale)
Students find many ways to pay fortheir post-secondary education Q: How have you paid for your post-secondary education/training experience? (check all that apply)
More graduates are following theirpost-HS plan, but many are not Q: Since graduating from high schools, did you follow through with your original High School & Beyond plan?
Open-Ended Responses: Common Themes Q: What was missing from your high school experience that would have better prepared you for life after high school? • Mainly practical financial skills (e.g., handling taxes and bills, banking, money management, loan applications) Q: Name a program, activity, or event that had a significant impact on you as a student and what made it significant. • AP classes, specific clubs or sports, and individual teachers who had a personal connection with the student • Some experiences were not positive
Our Next Steps • Continue with the 3 follow-up surveys (1/3/5 years after graduation) • Continue alignment of Senior Exit Survey • Share results with principals, counselors, staff and make changes • Get emails from all graduates in their senior year 2019 2018 2017 2016 2015 2014
Questions, Implications, and Next Steps What are you still curious about? What else do you want to know? If these were your results, what implications would they have for your schools and district? What would you want to celebrate, and what would you want to change? What are your next steps?