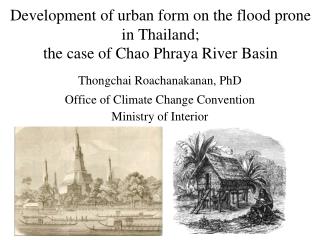
Download
1 / 12
120 likes | 290 Views
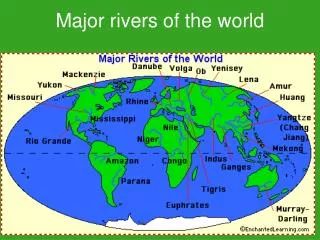
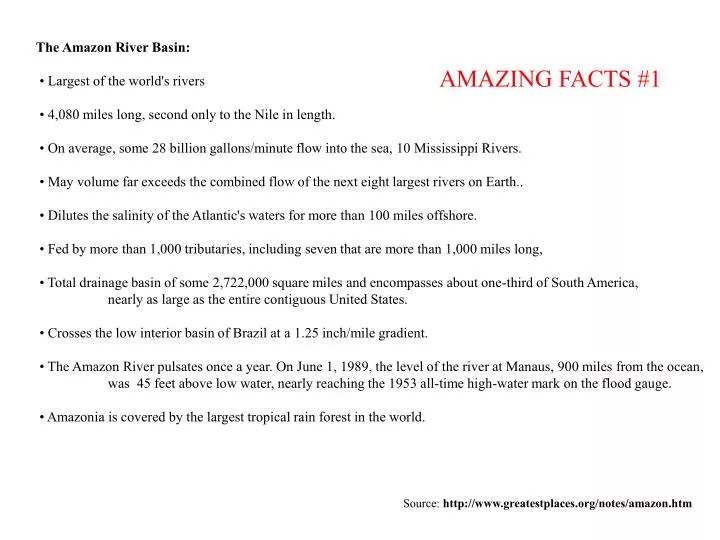
The Amazon River Basin: • Largest of the world's rivers • 4,080 miles long, second only to the Nile in length. • On average, some 28 billion gallons/minute flow into the sea, 10 Mississippi Rivers. • May volume far exceeds the combined flow of the next eight largest rivers on Earth..

E N D
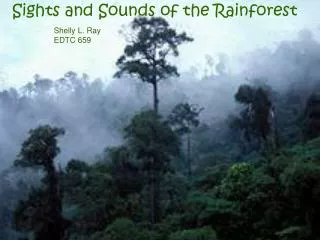
The Amazon River Basin: • Largest of the world's rivers • 4,080 miles long, second only to the Nile in length. • On average, some 28 billion gallons/minute flow into the sea, 10 Mississippi Rivers. • May volume far exceeds the combined flow of the next eight largest rivers on Earth.. • Dilutes the salinity of the Atlantic's waters for more than 100 miles offshore. • Fed by more than 1,000 tributaries, including seven that are more than 1,000 miles long, • Total drainage basin of some 2,722,000 square miles and encompasses about one-third of South America, nearly as large as the entire contiguous United States. • Crosses the low interior basin of Brazil at a 1.25 inch/mile gradient. • The Amazon River pulsates once a year. On June 1, 1989, the level of the river at Manaus, 900 miles from the ocean, was 45 feet above low water, nearly reaching the 1953 all-time high-water mark on the flood gauge. • Amazonia is covered by the largest tropical rain forest in the world. AMAZING FACTS #1 Source: http://www.greatestplaces.org/notes/amazon.htm
•Brazil contains 30% of the world's tropical forests • 5.4 million acres (estimate averaged for period 1979-1990) of Brazilian rainforest are destroyed each year. • Forest destruction from 1995 to 2000 averaged almost two million hectares a year, equivalent to seven football fields a minute (some debate on this!). • 6-9 million indigenous people inhabited the Brazilian rainforest in 1500. In 1992, less than 200,000 remain. ( some debate on this--see recent Atlantic magazines). • In a 4 mile square of Brazilian tropical forest there are over 750 species of trees, 125 species of mammals, 400 species of birds and 100 species of reptiles. Most of these species are found nowhere else in the world. There are as many species of ants in a single Peruvian tree than in the entire British Isles. • Scientists estimate an average of 137 species of life forms are driven into extinction every day, or 50,000 each year. [Source: http://earthrenewal.org/rainless.htm#1] AMAZING FACTS #2
“International zone” Hoax sweeping Brazil: page from supposed American geography text, proposing the “internationalization” of the Amazon. [source Veja magazine.] • The USA has no monopoly on xenophobia, (but there is a serious lesson,too!)
The Amazon forest carbon sink, or is it a source? Positive: natural tree growth secondary succession after logging Negative: Respiration (decay) Deforestation (burning) If carbon goes into the forest, oxygen comes out. “The Lungs of the World” Say it’s so! NOT.
Eddy covariance approach: what goes up and what comes down. U w T
The Amazon forest carbon sink, or is it a source? Positive: natural tree growth secondary succession after logging Negative: Respiration (decay) Deforestation (burning) If carbon goes into the forest, oxygen comes out. “The Lungs of the World” Say it’s so! NOT.
How to track the carbon balance of a continental-sized area? Land use monitoring: satellite surveys (clouds are not your friends). (also fire monitoring). Study intact forests: check forest state (takes a long time). Study the CO2 budget: small scale: chambers (1 m2) tower scale: several km2, turbulence method. <-- region/synoptic scale: 1000’s km2, budget methods. modeling studies (mesoscale --> GCM)
Summary of published estimates [Houghton, 1997] Global reservoirs of Carbon (Pg-C) 1 Pg = 1,000,000,000,000,000 grams Atmosphere 760 Terrestrial Vegetation 440-550 Soil organic matter (to1m depth) 1,400 Oceans 38,000 Direct measurement of uptake (kg-C/hectare/hour) Max uptake in light -8.6 Release at night: +2.8 24-h net uptake 0.11 – 0.25 (depends on reference) (It may go either way!) studies based on limited periods of observation: also methodological difficuties! Recent annual estimates from direct fluxes: -1 T-C /ha/year (Jaru, Mahli) (European & Brazilian teams) -5.9 T-C/ha/year (Manaus, Grace) -3,-7 T-C/ha/year (7 sites, Kabat) Emissions of carbon flux from changes in land use and combustion of fossil fuels (Pg-C/year, various references) Brazilian Amazon 0.28 Entire tropics 1.6 (+- 0.5) Global land use change 1.6 (+- 0.7) Global combustion of fossil fuels 5.5 (+- 0.5) Total global emissions 7.1 (+- 0.9)
Results of the logging-- the “patio” where logs were brought. Small clearings where tree removed Map logged areas upwind of tower
Eddy covariance approach: what goes up and what comes down. U w T
More wind at km67! The first year’s comparison of data from the two forest towers. The old-growth site (km67) The “cut” site (km 83) Before selective logging! Wind mixing rate Principal teams: km 83 U. Cal. Irvine km 67 Harvard U. Visible light
Annual Carbon uptake sums (U Cal. Irvine, Miller & Goulden) km 83 “Cut” site. Answer depends on how you deal with the respiration rate (the nocturnal fluxes).

![Strategic Analysis of India’s National River-Linking Project [NRLP]](https://cdn0.slideserve.com/691881/strategic-analysis-of-india-s-national-river-linking-project-nrlp-dt.jpg)