Download
1 / 16
160 likes | 277 Views
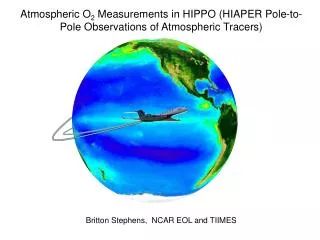
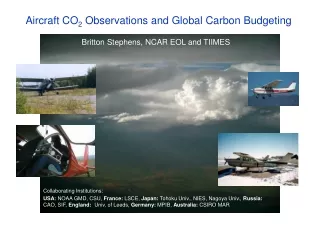
Airborne Observations of Atmospheric O 2 and CO 2 on Regional to Global Scales. Britton Stephens (NCAR, Boulder, USA and NIWA, Wellington, New Zealand)

E N D
Airborne Observations of Atmospheric O2 and CO2 on Regional to Global Scales Britton Stephens (NCAR, Boulder, USA and NIWA, Wellington, New Zealand) Coauthors: Steve Shertz and Andrew Watt (NCAR), Jonathan Bent and Ralph Keeling (SIO), Steve Wofsy, Bruce Daube, Rodrigo Jimenez and Eric Kort (Harvard), Sara Mikaloff-Fletcher (NIWA)
Atmospheric O2 Measurements dO2/N2 (per meg) = [(O2/N2)sample/(O2/N2)reference -1]x 106 Can be measured with: Interferometer Mass-spectrometer Paramagnetic analyzer Fuel-cell analyzer Gas chromatograph VUV absorption analyzer Provide insight into: Global land-ocean carbon flux partitioning Oceanic transport and exchange of O2 and CO2 Seasonal ocean productivity Air-sea gas-exchange Plant physiology Fossil-fuel emission signals Atmospheric transport
NCAR Airborne Oxygen Instrument (AO2) Flow control: • Vacuum ultraviolet absorption technique • Xe lamp (147 nm) and CsI detector • Adapted from shipboard design (Stephens et al., 2003) • Active pressure and flow control to 10-6 • Switches every 2.5 seconds between sample and WT gas • 5-second 1-sigma precision of ± 2 per meg • Factor of 2-5 motion degradation is correctable O2 sensor
NCAR Airborne Oxygen Instrument (AO2) System components:
NCAR Airborne Oxygen Instrument (AO2) 3-min cal 8-hour flight
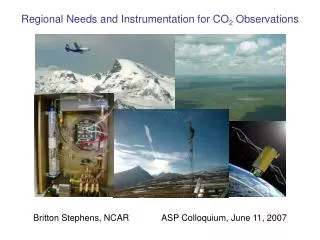
Stratosphere-Troposphere Analyses of Regional Transport • START-08 • PIs: Laura Pan (NCAR), Elliot Atlas (U. Miami), Ken Bowman (TAMU) • NSF / NCAR Gulfstream V • April – June, 2008 • Physical and chemical studies of the UTLS region • 20 flights for a total of 111 hours
Descent into Grand Forks, ND Boundary-layer transition June 23, 2008 at 1600 LT
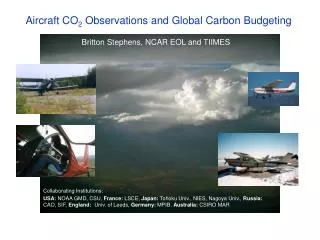
HIAPER Pole-to-Pole Observations of Atmospheric Tracers • HIPPO • PIs: Harvard, NCAR, Scripps, NOAA • Global and seasonal survey of CO2, O2, CH4, CO, N2O, H2, SF6, COS, CFCs, HCFCs, O3, H2O, black carbon, and hydrocarbons • NSF / NCAR Gulfstream V • 5 campaigns over 4 years • HIPPO1 in January of 2009, with 13 flights for 85 hours • Continuous profiling from surface to 10 km and to 15 km twice per flight HIPPO Flight tracks January 2009
HIPPO Profile at 80 N January 12, 2009
HIPPO Profile at 65 S Southern Ocean O2 outgassing January 20, 2009
Comparison to HIPPO flask samples • Possibly related to temperature gradients in reference cylinders • Temperatures were measured at 6 points in the cylinder box • Options exist for back-correcting and revising procedures to minimize effect
O2 Cross Section, January, 2009 per meg
CO2 Cross Section, January, 2009 AO2 Instrument ppm
APO Cross Section, January, 2009 per meg Atmospheric Potential Oxygen: APO = O2 + 1.1*CO2
Preliminary model comparisons January Mean APO from Climatological fluxes in TM3 HIPPO1 APO Observations per meg Fluxes: Mean ocean O2: Gruber et al., 2001 Seasonal ocean O2 and N2: Garcia and Keeling, 2001 Mean ocean N2: Gloor et al., 2001 Seasonal + mean ocean CO2: Takahashi et al., 2009 Fossil-fuel CO2 and O2: CDIAC
Looking ahead: • Laboratory experiments to isolate source of in situ – flask offset • Software improvements to reduce remaining motion sensitivity • 4 more HIPPO campaigns: Oct/Nov 2009, Apr 2010, Jun 2011, Sep 2011 • We welcome collaboration with atmospheric, oceanic, and terrestrial modelers