Download
1 / 23
230 likes | 311 Views
Agreement Scores, Ideal Points, and Legislative Polarization . Betsy Sinclair Jennifer N. Victor University of Chicago University of Pittsburgh Seth Masket Gregory Koger University of Denver University of Miami. Organization of this Project.

E N D
Agreement Scores, Ideal Points, and Legislative Polarization Betsy Sinclair Jennifer N. Victor University of Chicago University of Pittsburgh Seth Masket Gregory Koger University of Denver University of Miami
Organization of this Project • (Re)introduce “agreement scores” to the political science community as a measure of legislative behavior. • Compare agreement scores to other commonly used legislative behavior measures, such as NOMINATE. • Apply agreement scores to theories of legislative polarization. • Demonstrate that agreement scores provide similar findings about the sources of polarization, without hefty assumptions about independence.
The Study of Legislative Voting (A Brief History) • Studying the voting cohesion of legislative party members: Lowell (1902), Rice (1925) • “Agreement Scores”: Truman (1959) • Party cohesion: Mayhew (1966), Sinclair (1976, 1977) • Signaling, cue taking: Kingdon 1989, Matthews and Stimson (1975) • The NOMINATE revolution: Poole and Rosenthal (1985, 1997)
What’s the Trouble with NOMINATE? • Assume legislators always vote for policies closer to their ideal point. • Votes are treated as a single-shot game. • Spatial model assumptions make it difficult to discern the influence of constituents and parties (Krehbiel 1993, Sinclair 2002). • Unrealistic assumptions dimensionality of bills and legislators (Londregan 1999). • The independence assumption.
The Unreasonableness of Independence • Evidence of legislators influencing one another. • Logrolling: Calvert and Fenno 1994 • Social interaction • Boardinghouses: Young 1966 • Cue Taking: Kingdon 1973, Matthews and Stimson 1975 • Seat Assignments: Masket 2008 • Cosponsorship: Koger 2003, Fowler 2006 • Caucus participation: Victor and Ringe 2009
We Need a New Hammer • We require a tool that doesn’t require us to assume legislators are atomistic actors. • Network Analysis.
Agreement Scores • For each Congress, create an M-by-M matrix, where M is the number of legislators in a Congress. • The cells in the matrix describe the rate that any two legislators voted the same way, given that they both voted. • Adjacency matrix, A, with agreement between i and j. • A disadvantage: bills treated equally
An Illustrative Application: Sources of Legislative Polarization • Theory 1: Mass Partisanship Trends • Red state/Blue state • Evidence in NOMINATE scores • H1: Do we observe increasing agreement among same party legislators over time? • Theory 2: Institutional Influence • Size of the majority party determines party cohesion • H2: Do we observe decreasing agreement among same party pairs as the size of the majority party increases?
An Illustrative Application: Sources of Legislative Polarization • Theory 3: Party Culture • Republicans are more authoritarian, disciplined • H3: Do we observe increasing agreement among Republican pairs when Republicans are in the majority?
Empirical Investigation Data: Roll Call Votes from the 90th-110th Congresses (1967-2008). Calculate agreement scores among all pairs in each congress.
Conclusions—on Substance (no surprises) • Legislative parties are becoming more internally homogenous. • Parties vote with greater discipline when they are in near numerical parity in the chamber. • Republicans are more cohesive than Democrats.
Conclusions—On Methods (a lighter hammer) • We reach the same substantive conclusions as other research, but… • without complex mathematical algorithms or sophisticated programs, and… • without unrealistic assumptions of independence. • This method offers parsimony and intuitiveness, without sacrificing explanatory power.
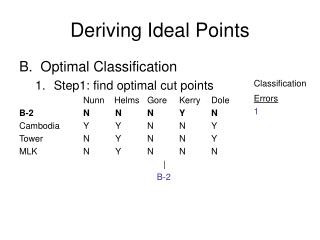
Simple Example • Consider 5 Senators’ votes over 4 bills • Votes are either “yea” (1) or “nay” (0)
Example: NOMINATE Helms Nunn Kerry Dole Gore -0.1 -0.08 -0.05 -0.02 0 0.01 0.03 0.05 0.08 0.1
Example: Agreement Scores • Calculate the agreement rate: = number of votes on which i,j agreed/number of votes on which i,j voted
Example: Agreement Scores • Calculate power centrality (Bonacich) • Measures “agreeability,” or tendency of member to vote with others. Describes power within a network (although direction is unclear).