Download
1 / 12
120 likes | 247 Views
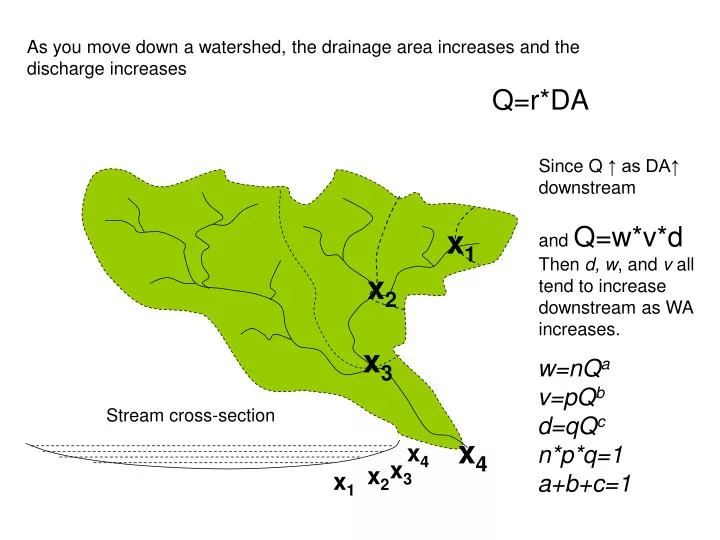
As you move down a watershed, the drainage area increases and the discharge increases. Q=r*DA. Since Q ↑ as DA↑ downstream and Q=w*v*d Then d, w , and v all tend to increase downstream as WA increases. x 1. x 2. x 3. w=nQ a v=pQ b d=qQ c n*p*q=1 a+b+c=1. Stream cross-section.

E N D
As you move down a watershed, the drainage area increases and the discharge increases Q=r*DA Since Q ↑ as DA↑ downstream and Q=w*v*d Then d, w, and v all tend to increase downstream as WA increases. x1 x2 x3 w=nQa v=pQb d=qQc n*p*q=1 a+b+c=1 Stream cross-section x4 x4 x3 x2 x1
Q=wvd=(nQa)*(pQb)*(qQc)=npqQa+b+c which can only be true if npq=a+b+c=1 These relationships can tell us how the width, velocity and depth of a river will change as its discharge increases or decreases. We can also write w,v and d as functions of DA since Q=rDA rDA=wvd=(n(rDA)a)*(p(rDA)b)*(q(rDA)c) So that w=nrDAa, v=prDAb, and d=qrDAc
How stream width increases with Drainage Area in the Upper Oldman R Log10 Drainage Area 1 2 3 0 100 2 o o o o Log10 width Width (m) Slope =0.55 o 10 1 o o o 0 1.0 10 100 1000 1 Drainage Area (km2) Log w =0.23 + 0.55 Log DA w= 1.7DA0.55 W DA
How stream velocity and depth increase with drainage area in the Upper Oldman R 1.0 Slope velocity line =0.2 o o o o o o o o Velocity m/sec o o o Slope of depth line=0.25 o 1.0 0.1 o o Depth m o o 0.1 10 100 1000 1 Drainage Area (km2) v=0.24 DA0.2 d=0.22 DA0.25 The exponents for width, velocity and depth add up to 1
Since w=nQa and v=pQb and d=qQc We can write Log w=Log (nQa)=Logn + LogQa = Log n + aLogQ Or since Q=rDA Log w=Log (nrDAa)=Logn + Log r + LogDAa = Log n + Log r + aLogDA And similarly Log v=Log p + Log r + bLogDA, and Log d=Log q + Log r + qLogDA, and Log Q=Log r + LogDA These relationships are useful since they allow us to plot the non-linear functions as linear graphs, and to establish exponent values using linear techniques.
v= 0.24 DA 0.2 Mean velocity (m/s) Drainage Area (km2) • The bell curves rising out of the plane of the graph depict the variability of the river’s flow regime at a series of points along the drainage—the bell curves get wider toward the right, illustrating the increasing range of variability downstream
Cumulative Frequency (percentiles) frequency 50% 100% 100% About 90% of the river has velocity less than this value velocity (m/s) 50% of the river has velocity less than this value Only about 10% of the river has velocity less than this value Two different ways of depicting variability
The % of the river <1.2 m/s decreases downstream Mean velocity (m/s) At lower velocity (eg 0.6 m/s) the downstream decrease in % occurs more rapidly Drainage Area (km2)
The distance between these two lines represents the proportion of the river with velocity between 0.8 – 1.0 m/s at the point where DA = 1000 km2 1.2 m/s Proportion < given velocity 1.0 m/s 0.8 m/s 0.6 m/s 0.4m/s 0.2m/s Drainage area (km2)
>1m/s very large adults o % of habitat o o 50 o o o 40 o o o 30 0.6-1m /sec adult trout o 0.2-0.6m/sec juvenile trout o o 20 o o o o o 10 o o o o 0-0.2m/sec trout fry o 500 1000 1500 2000 2500 Drainage area (km2) Low velocity habitats predominate in the upstream sections and medium and high velocity habitats become more predominant downstream
Fish and other aquatic biota that live in rivers and streams have to contend with the variability of the flow regime. How variable is runoff/discharge? From year to year? From month to month From day to day
Runoff is highly variable from year to year Fig 5-14 from your text