Download
1 / 1
100 likes | 350 Views
Sample trays. Total X-ray Fluorescence Spectroscopy (TXRF). Introduction. Sample types and preparation. TXRF is a versatile analytical technique for determining elemental content in liquids, solids and loose powders.

E N D
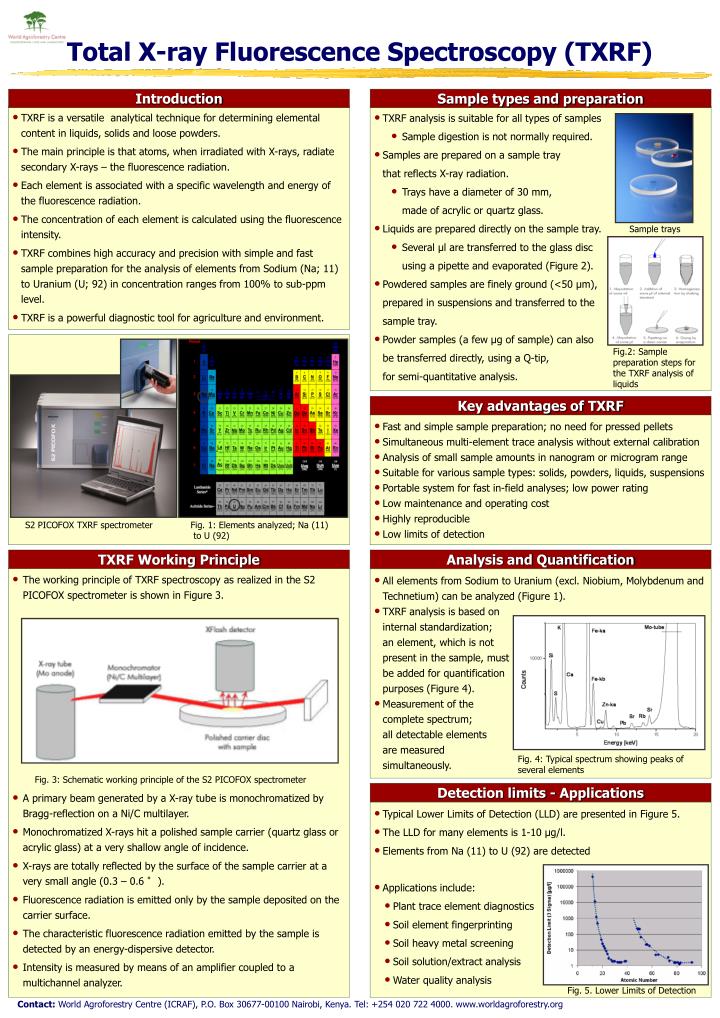
Sample trays Total X-ray Fluorescence Spectroscopy (TXRF) Introduction Sample types and preparation • TXRF is a versatile analytical technique for determining elemental content in liquids, solids and loose powders. • The main principle is that atoms, when irradiated with X-rays, radiate secondary X-rays – the fluorescence radiation. • Each element is associated with a specific wavelength and energy of the fluorescence radiation. • The concentration of each element is calculated using the fluorescence intensity. • TXRF combines high accuracy and precision with simple and fast sample preparation for the analysis of elements from Sodium (Na; 11) to Uranium (U; 92) in concentration ranges from 100% to sub-ppm level. • TXRF is a powerful diagnostic tool for agriculture and environment. • TXRF analysis is suitable for all types of samples • Sample digestion is not normally required. • Samples are prepared on a sample tray • that reflects X-ray radiation. • Trays have a diameter of 30 mm, • made of acrylic or quartz glass. • Liquids are prepared directly on the sample tray. • Several μl are transferred to the glass disc • using a pipette and evaporated (Figure 2). • Powdered samples are finely ground (<50 μm), • prepared in suspensions and transferred to the • sample tray. • Powder samples (a few μg of sample) can also • be transferred directly, using a Q-tip, • for semi-quantitative analysis. Fig.2: Sample preparation steps for the TXRF analysis of liquids Key advantages of TXRF • Fast and simple sample preparation; no need for pressed pellets • Simultaneous multi-element trace analysis without external calibration • Analysis of small sample amounts in nanogram or microgram range • Suitable for various sample types: solids, powders, liquids, suspensions • Portable system for fast in-field analyses; low power rating • Low maintenance and operating cost • Highly reproducible • Low limits of detection S2 PICOFOX TXRF spectrometer Fig. 1: Elements analyzed; Na (11) to U (92) TXRF Working Principle Analysis and Quantification • The working principle of TXRF spectroscopy as realized in the S2 PICOFOX spectrometer is shown in Figure 3. • A primary beam generated by a X-ray tube is monochromatized by Bragg-reflection on a Ni/C multilayer. • Monochromatized X-rays hit a polished sample carrier (quartz glass or acrylic glass) at a very shallow angle of incidence. • X-rays are totally reflected by the surface of the sample carrier at a very small angle (0.3 – 0.6 °). • Fluorescence radiation is emitted only by the sample deposited on the carrier surface. • The characteristic fluorescence radiation emitted by the sample is detected by an energy-dispersive detector. • Intensity is measured by means of an amplifier coupled to a multichannel analyzer. • All elements from Sodium to Uranium (excl. Niobium, Molybdenum and Technetium) can be analyzed (Figure 1). • TXRF analysis is based on • internal standardization; • an element, which is not • present in the sample, must • be added for quantification • purposes (Figure 4). • Measurement of the • complete spectrum; • all detectable elements • are measured • simultaneously. Fig. 4: Typical spectrum showing peaks of several elements Fig. 3: Schematic working principle of the S2 PICOFOX spectrometer Detection limits - Applications • Typical Lower Limits of Detection (LLD) are presented in Figure 5. • The LLD for many elements is 1-10 μg/l. • Elements from Na (11) to U (92) are detected • Applications include: • Plant trace element diagnostics • Soil element fingerprinting • Soil heavy metal screening • Soil solution/extract analysis • Water quality analysis Fig. 5. Lower Limits of Detection Contact: World Agroforestry Centre (ICRAF), P.O. Box 30677-00100 Nairobi, Kenya. Tel: +254 020 722 4000. www.worldagroforestry.org